
A majority of the nation’s 36 million workers ages 25 to 34 have not completed a four-year college degree. In 2023, there were 19 million young workers who had some college or less education, including those who had not finished high school.
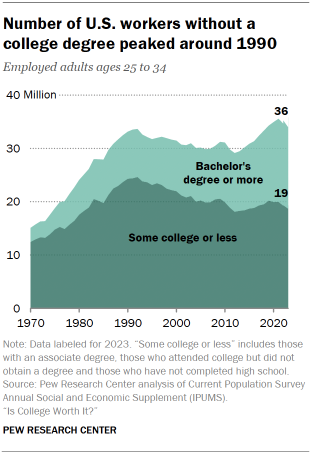
The overall number of employed young adults has grown over the decades as more young women joined the workforce. The number of employed young adults without a college degree peaked around 1990 at 25 million and then started to fall, as more young people began finishing college.
This chapter looks at the following key labor market and economic trends separately for young men and young women by their level of education:
- Labor force participation
- Individual earnings
- Household income
- Poverty
- Net worth1
Economic outcomes for young men
When looking at how young adults are doing in the job market, it generally makes the most sense to analyze men and women separately. They tend to work in different occupations and have different career patterns, and their educational paths have diverged in recent decades.
Labor force participation
In 1970, almost all young men whose highest educational attainment was a high school diploma (98%) were in the labor force, meaning they were working or looking for work. By 2013, only 88% of high school-educated young men were in the labor force. Today, that share is 87%.
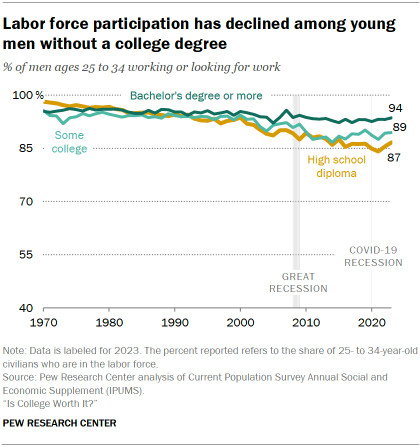
Similarly, 96% of young men whose highest attainment was some college education were in the labor force in 1970. Today, the share is 89%.
By comparison, labor force participation among young men with at least a bachelor’s degree has remained relatively stable these past few decades. Today, 94% of young men with at least a bachelor’s degree are in the labor force.
The long-running decline in the labor force participation of young men without a bachelor’s degree may be due to several factors, including declining wages, the types of jobs available to this group becoming less desirable, rising incarceration rates and the opioid epidemic.2
Looking at labor force and earnings trends over the past several decades, it’s important to keep in mind broader forces shaping the national job market.
The Great Recession officially ended in June 2009, but the national job market recovered slowly. At the beginning of the Great Recession in the fourth quarter of 2007, the national unemployment rate was 4.6%. Unemployment peaked at 10.4% in the first quarter of 2010. It was not until the fourth quarter of 2016 that unemployment finally returned to its prerecession level (4.5%).
Studies suggest that things started to look up for less-skilled workers around 2014. Among men with less education, hourly earnings began rising in 2014 after a decade of stagnation. Wage growth for low-wage workers also picked up in 2014. The tightening labor markets in the last five years of the expansion after the Great Recession improved the labor market prospects of “vulnerable workers” considerably.
The COVID-19 pandemic interrupted the tight labor market, but the COVID-19 recession and recovery were quite different from the Great Recession in their job market impact. The more recent recession was arguably more severe, as the national unemployment rate reached 12.9% in the second quarter of 2020. But it was short – officially lasting two months, compared with the 18-month Great Recession – and the labor market bounced back much quicker. Unemployment was 3.3% before the COVID-19 recession; three years later, unemployment had once again returned to that level.
Full-time, full-year employment
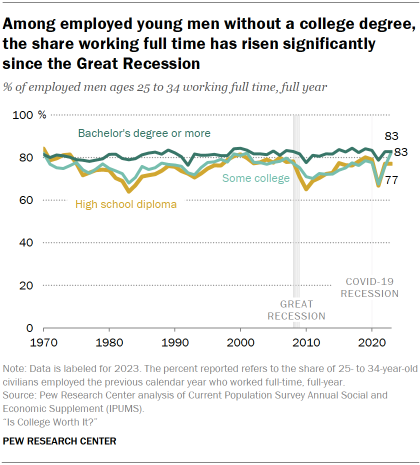
Since the Great Recession of 2007-09, young men without a four-year college degree have seen a significant increase in the average number of hours they work.
- Today, 77% of young workers with a high school education work full time, full year, compared with 69% in 2011.
- 83% of young workers with some college education work full time, full year, compared with 70% in 2011.
The share of young men with a college degree who work full time, year-round has remained fairly steady in recent decades – at about 80% – and hasn’t fluctuated with good or bad economic cycles.
Annual earnings
Annual earnings for young men without a college degree were on a mostly downward path from 1973 until roughly 10 years ago (with the exception of a bump in the late 1990s).3
Earnings have been increasing modestly over the past decade for these groups.
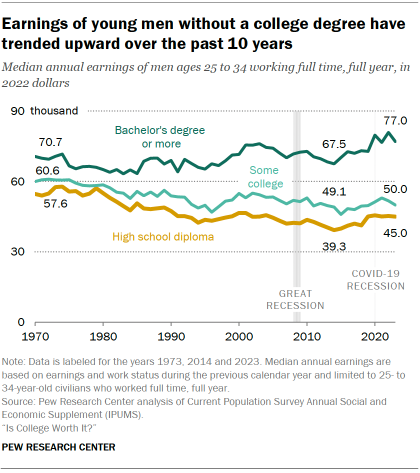
- Young men with a high school education who are working full time, full year have median earnings of $45,000 today, up from $39,300 in 2014. (All figures are in 2022 dollars.)
- The median earnings of young men with some college education who are working full time, full year are $50,000 today, similar to their median earnings in 2014 ($49,100).
It’s important to note that median annual earnings for both groups of noncollege men remain below their 1973 levels.
Median earnings for young men with a four-year college degree have increased over the past 10 years, from $67,500 in 2014 to $77,000 today.
Unlike young men without a college degree, the earnings of college-educated young men are now above what they were in the early 1970s. The gap in median earnings between young men with and without a college degree grew significantly from the late 1970s to 2014. In 1973, the typical young man with a degree earned 23% more than his high school-educated counterpart. By 2014, it was 72% more. Today, that gap stands at 71%.4
Household income
Household income has also trended up for young men in the past 10 years, regardless of educational attainment.
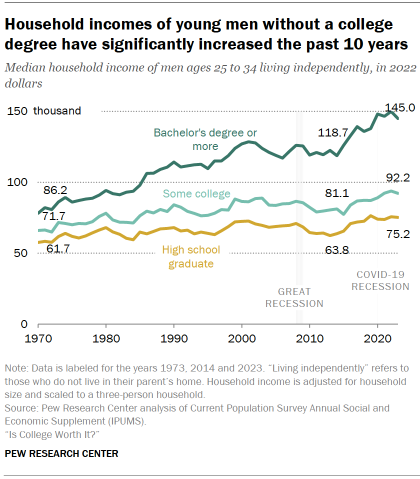
This measure takes into account the contributions of everyone in the household. For this analysis, we excluded young men who are living in their parents’ home (about 20% of 25- to 34-year-old men in 2023).
- The median household income of young men with a high school education is $75,200 today, up from $63,800 in 2014. This is slightly lower than the highpoint reached around 2019.
- The median household income of young men with some college education is $92,200 today, up from $81,100 in 2014. This is close to the 2022 peak of $93,800.
The median household income of young men with at least a bachelor’s degree has also increased from a low point of $118,700 in 2014 after the Great Recession to $145,000 today.
The gap in household income between young men with and without a college degree grew significantly between 1980 and 2014. In 1980, the median household income of young men with at least a bachelor’s degree was about 38% more than that of high school graduates. By 2014, that gap had widened to 86%.
Over the past 10 years, the income gap has fluctuated. In 2023, the typical college graduate’s household income was 93% more than that of the typical high school graduate.
Poverty
The 2001 recession and Great Recession resulted in a large increase in poverty among young men without a college degree.
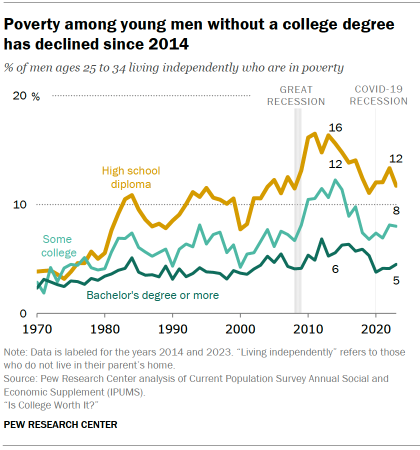
- In 2000, among young men living independently of their parents, 8% of those with a high school education were in poverty. Poverty peaked for this group at 17% around 2011 and has since declined to 12% in 2023.
- Among young men with some college education, poverty peaked at 12% around 2014, up from 4% in 2000. Poverty has fallen for this group since 2014 and stands at 8% as of 2023.
- Young men with a four-year college degree also experienced a slight uptick in poverty during the 2001 recession and Great Recession. In 2014, 6% of young college graduates were in poverty, up from 4% in 2000. Poverty among college graduates stands at 5% in 2023.
Economic outcomes for young women
Labor force trends for young women are very different than for young men. There are occupational and educational differences between young women and men, and their earnings have followed different patterns.
Labor force participation
Unlike the long-running decline for noncollege young men, young women without a college degree saw their labor force participation increase steadily from 1970 to about 1990.
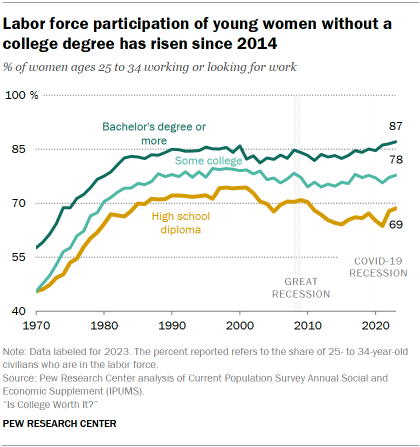
By 2000, about three-quarters of young women with a high school diploma and 79% of those with some college education were in the labor force.
Labor force participation has also trended upward for college-educated young women and has consistently been higher than for those with less education.
After rising for decades, labor force participation for young women without a college degree fell during the 2001 recession and the Great Recession. Their labor force participation has increased slightly since 2014.
As of 2023, 69% of young women with a high school education were in the labor force, as were 78% of young women with some college education. Today’s level of labor force participation for young women without a college degree is slightly lower than the level seen around 2000.
The decline in labor force participation for noncollege women partly reflects the declining labor force participation for mothers with children under 18 years of age. Other research has suggested that without federal paid parental and family leave benefits for parents, some women with less education may leave the labor force after having a baby.
In contrast, labor force participation for young women with a college degree has fully recovered from the recessions of the early 2000s. Today, 87% of college-educated young women are in the labor force, the highest estimate on record.
Full-time, full-year employment
Young women without a college degree have steadily increased their work hours over the decades. The past 10 years in particular have seen a significant increase in the share of employed noncollege women working full time, full year (with the exception of 2021).
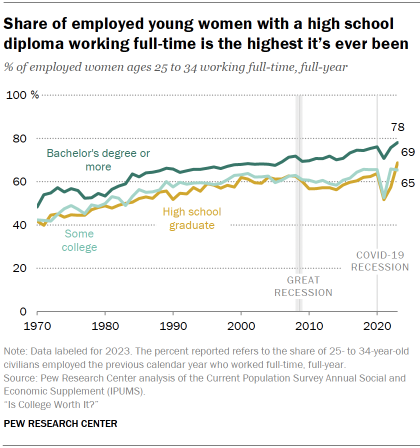
- In 2023, 69% of employed young women with a high school education worked full time, full year, up from 56% in 2014. This share is the highest it’s ever been.
- In 2023, 65% of employed women with some college worked full time, full year, up from 58% in 2014. This is among the highest levels ever.
The trend in the share working full time, full year has been similar for young women with college degrees. By 2023, 78% of these women worked full time, full year, the highest share it’s ever been.
Annual earnings
Unlike young men, young women without a college education did not see their earnings fall between 1970 and 2000.
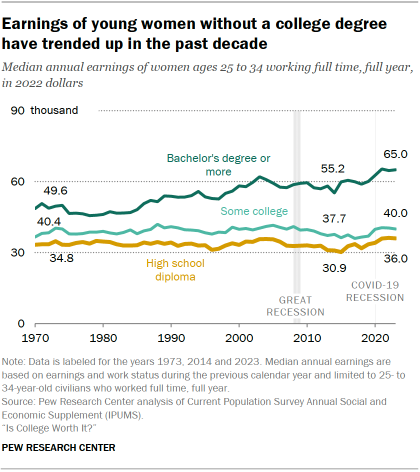
The 2001 recession and Great Recession also did not significantly impact the earnings of noncollege young women. In the past 10 years, their median earnings have trended upward.
- For young women with a high school diploma, median earnings reached $36,000 in 2023, up from $30,900 in 2014.
- For those with some college, median earnings rose to $40,000 in 2023 from $37,700 in 2014.
For young women with a college degree, median earnings rose steadily from the mid-1980s until the early 2000s. By 2003, they reached $62,100, but this declined to $55,200 by 2014. In the past 10 years, the median earnings of college-educated young women have risen, reaching $65,000 in 2023.
In the mid-1980s, the typical young woman with a college degree earned about 48% more than her counterpart with a high school diploma. The pay gap among women has widened since then, and by 2014, the typical college graduate earned 79% more than the typical high school graduate. The gap has changed little over the past 10 years.
Household income
Noncollege young women living independently from their parents have experienced large household income gains over the past 10 years, measured at the median.
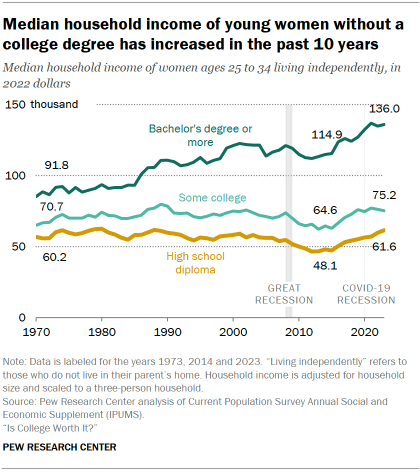
- In 2023, young women with a high school diploma had a median household income of $61,600, up from $48,100 in 2014.
- The pattern is similar for young women with some college education. Their median income rose to $75,200 in 2023 from $64,600 in 2014.
The median household income for young women with a four-year college degree is significantly higher than it is for their counterparts without a degree. College-educated young women have made substantial gains in the past 10 years.
The income gap between young women with and without a college degree has widened over the decades. In 1980, the median household income of young women with a college degree was 50% higher than that of high school-educated women. By 2014, the income gap had grown to 139%. Today, the household income advantage of college-educated women stands at 121% ($136,000 vs. $61,600).
Poverty
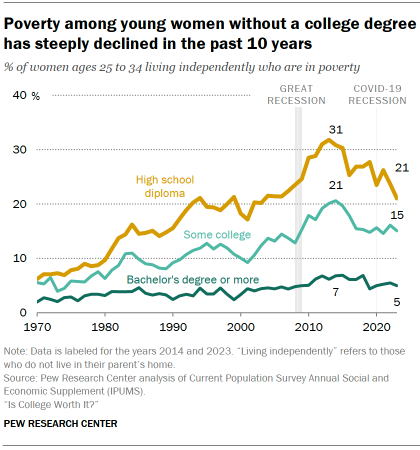
Poverty trends for young women mirror those for young men, although young women are overall more likely to be in poverty than young men. The past 10 years have resulted in a steep reduction in the share of noncollege women in poverty.
- Today, 21% of young women with a high school diploma are living in poverty. This is down from 31% in 2014.
- 15% of young women with some college education live in poverty, compared with 21% in 2014.
- Young women with a college degree are consistently far less likely than either group to be living in poverty (5% in 2023).
Wealth trends for households headed by a young adult
Along with young adults’ rising incomes over the past 10 years, there’s been a substantial increase in their wealth. This part of our analysis does not look at men and women separately due to limitations in sample size.
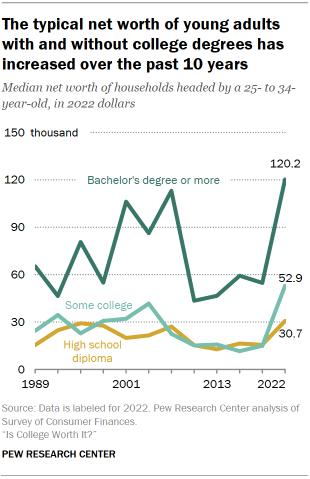
In 2022, households headed by a young high school graduate had a median net worth of $30,700, up from $12,700 in 2013. Those headed by a young adult with some college education had a median net worth of $52,900, up from $15,700 in 2013.
The typical wealth level of households headed by a young college graduate was $120,200 in 2022, up from $46,600 in 2013.
There has not been any significant narrowing of the wealth gap between young high school graduate and young college graduate households since 2013.
Wealth increased for Americans across age groups over this period due to several factors. Many were able to save money during the pandemic lockdowns. In addition, home values increased, and the stock market surged.


