

The U.S. Supreme Court’s decision to limit affirmative action in higher education is likely to have the biggest impact on a relatively small group of schools – primarily highly selective private colleges and universities, according to a new Pew Research Center analysis.
The question of how, if at all, race and ethnicity should figure into college admissions decisions goes back decades – at least to the Supreme Court’s 1978 decision in Regents of the University of California v. Bakke, which outlawed specific quotas for minority groups but allowed the use of race as one factor among many in admissions decisions. Given the Supreme Court’s recent rulings on affirmative action, Pew Research Center wanted to find out just how widespread the practice of factoring race and ethnicity into admissions decisions has been.
There are roughly 4,200 postsecondary degree-granting educational institutions in the United States, but many were outside the scope of this research. We started by downloading a list of institutions from the Integrated Postsecondary Education Data System (IPEDS), which is maintained by the U.S. Education Department. After filtering out for-profit schools, schools that don’t primarily offer bachelor’s degrees, non-accredited/non-degree schools and schools with “open admissions” policies (under which virtually all applicants with a high school diploma or the equivalent are admitted), we were left with 1,550 institutions.
Among the trove of data maintained by IPEDS are figures from each school on how many people applied for admission in the 2021-22 school year and how many were actually admitted. By dividing the latter into the former, we calculated admission rates for all 1,550 schools.
Since race and ethnicity considerations are more likely to be contentious at schools where demand for admission greatly outstrips available spots, we decided to focus on schools that admitted half or fewer of all their applicants for 2021-22. That brought our study group down to about 200 schools.
Our source for how much consideration (if any) a particular school gives applicants’ race and ethnicity is its Common Data Set, or CDS. The CDS was developed more than two decades ago by the College Board, Peterson’s and U.S. News and World Report as a way to both increase transparency and comparability among institutions and ease their burden of having to respond to multiple overlapping data requests from publishers of college rankings. Many (but not all) colleges participate in the CDS initiative, and many (but not all) of those publish their completed questionnaires on their websites. We searched for CDS forms for all 200+ schools on our target list, for as many years as the schools made them available.
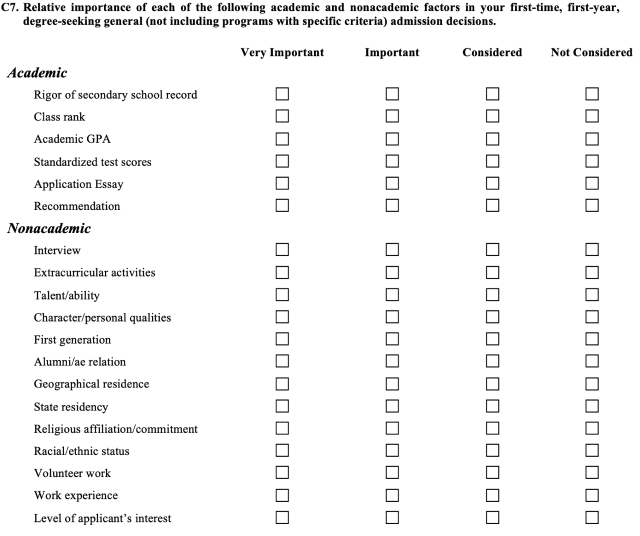
Among the items on the CDS is a list of 19 academic and nonacademic factors (including “racial/ethnic status”) that might or might not go into a school’s admission decisions. Schools can rate each factor, in descending order, as “very important,” “important,” “considered” or “not considered.”
We further limited our study group to schools with a publicly available CDS for at least one of the past three academic years, and which assigned a rating to the “racial/ethnic status” item. In the end, 123 schools fit all our criteria.
Each CDS also contains a breakdown of the school’s undergraduate population by race and ethnicity. We used that data to calculate the diversity of each school’s student body for the most recent academic year available. Undergraduates who aren’t U.S. residents are counted separately and aren’t categorized by race or ethnicity, so we excluded them from the calculations.
While there is no comprehensive list of colleges and universities in the United States that consider race and ethnicity as a factor in admissions decisions, many schools report information about themselves in a standard format called the Common Data Set (CDS) and make it available online. Among the items on the CDS is a list of 19 academic and nonacademic factors that might go into a school’s admissions decisions. Schools can rate each factor as, in descending order of significance, “very important,” “important,” “considered” or “not considered.”
We examined CDS forms from 123 selective colleges and universities – which we defined as those that admit half or fewer of their applicants – to see whether they considered race and ethnicity as a factor in deciding whom to admit, and if so, how significant a factor it was. We only looked at schools that had filled out that portion of the CDS in at least one of the past three academic years.
Of these schools, 74% (91 out of 123) said they did consider race and ethnicity, with 10 of those describing it as an important factor. The vast majority of those schools (82) are private, not-for-profit institutions.
About a quarter of the schools we examined (32, or 26%) said they did not consider race and ethnicity at all. Of those, most (22) are public colleges and universities.
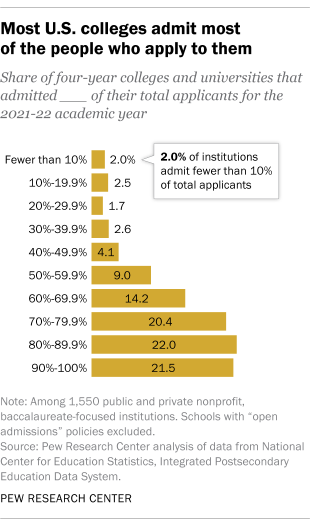
As an earlier Center analysis found, most colleges and universities admit most of the people who apply to them. In the 2021-22 school year, only 202 out of 1,550 four-year colleges and universities admitted half or fewer of the people who applied to them, based on our most recent analysis of data from the federal government’s Integrated Postsecondary Education Data System.
This analysis about the consideration of race and ethnicity in admissions decisions is limited to public and private not-for-profit institutions that offer bachelor’s degrees and higher credentials, and have published a recent CDS on their website. For more details, refer to the “How we did this” box.
Highly selective and private colleges more likely to consider race and ethnicity
In general, consideration of race and ethnicity is more common among schools with the lowest admission rates.
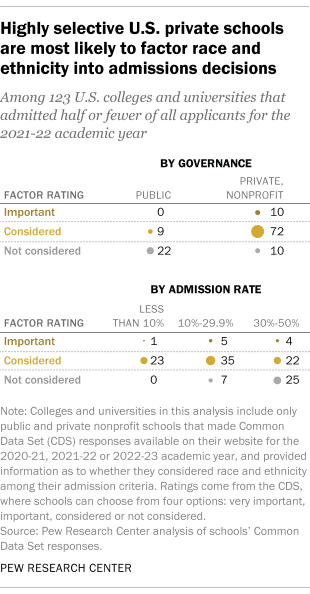
In the Center’s analysis of selective schools with publicly available CDS data, all 24 schools that admit fewer than 10% of applicants say they consider race and ethnicity when deciding whom to admit, although only one rated it as an important factor. And among the 48 schools that admit between 10% and 30% of applicants, all but seven consider race and ethnicity in admissions, with five rating it as an important factor.
But among the 51 schools that admit between 30% and half of all applicants, just over half (26, or 51%) consider race and ethnicity, and only four call it an important factor. Nearly half of those schools (25, or 49%) say they don’t consider race and ethnicity at all.
Among the colleges in our study group, the average admissions rate is lower among schools that consider race and ethnicity than among those that don’t (21.7% vs. 37.4%).
Also, consideration of race and ethnicity is more common for private colleges and universities, at least among the institutions we studied. All but 10 of the 92 private colleges and universities we examined (89%) considered race and ethnicity in deciding whom to admit, with 10 of those ranking it as an important factor.
But among the 31 public schools, only nine (29%) considered race and ethnicity at all, and none rated it as an important factor. (One partial explanation: Nine of the 22 public schools that don’t consider race and ethnicity in admissions are in California, where voters banned the practice in a 1996 ballot initiative.)
Notably, the schools that rated race and ethnicity as an important factor in admissions decisions had, in aggregate, less diverse student bodies than those that didn’t. In those 10 schools, White students made up nearly 56% of undergraduate enrollment (excluding non-U.S. residents), compared with just over half among schools that said they considered race and ethnicity as one factor among many, and 41% among schools that said they didn’t consider it at all. In that last group of schools, Hispanic students accounted for nearly a quarter of aggregate undergraduate enrollment – largely because the group includes several big public universities in California and Florida with sizable Hispanic student populations.
