
This report explores Latinas’ economic and demographic progress in the last two decades – and their perceptions of that progress – using several data sources.
The first is a Pew Research Center survey of 5,078 Hispanic adults, including 2,600 Hispanic women. Respondents were asked whether U.S. Latinas saw progress in their situation in the last decade, whether they expected any in the future decade, and how big a problem the U.S. gender pay gap is. The survey was conducted from Nov. 6 to 19, 2023, and includes 1,524 respondents from the American Trends Panel (ATP) and an additional 3,554 from Ipsos’ KnowledgePanel.
Respondents on both panels are recruited through national, random sampling of residential addresses. Recruiting panelists by mail ensures that nearly all U.S. adults have a chance of selection. This gives us confidence that any sample can represent the whole population, or in this case the whole U.S. Hispanic population. (For more information, watch our Methods 101 explainer on random sampling.) For more information on this survey, refer to the American Trends Panel survey methodology and the topline questionnaire.
The second data source is the U.S. Census Bureau’s and Bureau of Labor Statistics’ 2003, 2008, 2013, 2018 and 2023 Current Population Survey (CPS) Monthly and Annual Social and Economic Supplement (ASEC) data series, provided through the Integrated Public Use Microdata Series (IPUMS) from the University of Minnesota.
The CPS Monthly microdata series was used only to calculate median hourly earnings for those ages 25 to 64 years old and who were not self-employed. Medians were calculated for the whole year by considering all wages reported in that year, regardless of month. Median wages were then adjusted to June 2023 dollars using the Chained Consumer Price Index for All Urban Consumers for June of each year. For more information on the demographic analysis, refer to the methodology for the analysis of the Current Population Survey.
The terms Hispanic and Latino are used interchangeably in this report.
The terms Latinas and Hispanic women are used interchangeably throughout this report to refer to U.S. adult women who self-identify as Hispanic or Latino, regardless of their racial identity.
Foreign born refers to persons born outside of the 50 U.S. states or the District of Columbia. For the purposes of this report, foreign born also refers to those born in Puerto Rico. Although individuals born in Puerto Rico are U.S. citizens by birth, they are grouped with the foreign born because they are born into a Spanish-dominant culture and because on many points their attitudes, views and beliefs are much closer to those of Hispanics born outside the U.S. than to Hispanics born in the 50 U.S. states or D.C., even those who identify themselves as being of Puerto Rican origin.
The terms foreign born and immigrant are used interchangeably in this report. Immigrants are also considered first-generation Americans.
U.S. born refers to persons born in the 50 U.S. states or D.C.
Second generation refers to people born in the 50 U.S. states or D.C. with at least one immigrant parent.
Third or higher generation refers to people born in the 50 U.S. states or D.C., with both parents born in the 50 U.S. states or D.C.
Throughout this report, Democrats are respondents who identify politically with the Democratic Party or those who are independent or identify with some other party but lean toward the Democratic Party. Similarly, Republicans are those who identify politically with the Republican Party and those who are independent or identify with some other party but lean toward the Republican Party.
White, Black and Asian each include those who report being only one race and are not Hispanic.
Civilians are those who were not in the armed forces at the time of completing the Current Population Survey.
Those participating in the labor force either were at work; held a job but were temporarily absent from work due to factors like vacation or illness; were seeking work; or were temporarily laid off from a job in the week before taking the Current Population Survey. In this report, the labor force participation rate is shown only for civilians ages 25 to 64.
The phrases living with children or living with their own child describe individuals living with at least one of their own stepchildren, adopted children or biological children, regardless of the children’s ages. The phrases not living with children or not living with their own child describe individuals who have no children or whose children do not live with them.
Occupation and occupational groups describe the occupational category of someone’s current job, or – if unemployed – most recent job. In this report we measure occupation among civilians participating in the labor force. Occupational groups are adapted from the U.S. Census Bureau’s occupation classification list from 2018 onward.
Hourly earnings, hourly wages and hourly pay all refer to the amount an employee reported making per hour at the time of taking the Current Population Survey where they were employed by someone else. Median hourly wages were calculated only for those ages 25 to 64 who were not self-employed. Calculated median hourly wages shared in this report are adjusted for inflation to 2023. (A median means that half of a given population – for example, Hispanic women – earned more than the stated wage, and half earned less.)
Breadwinners refer to those living with a spouse or partner, both ages 25 to 64, who make over 60% of their and their partner’s combined, positive income from all sources. Those in egalitarian relationships make 40% to 60% of the combined income. For those who make less than 40% of the combined income, their spouse or partner is the breadwinner. This analysis was conducted among both opposite-sex and same-sex couples.
Half of Latinas say the situation of Hispanic women in the United States is better now than it was 10 years ago, and a similar share say the situation will improve in the next 10 years.
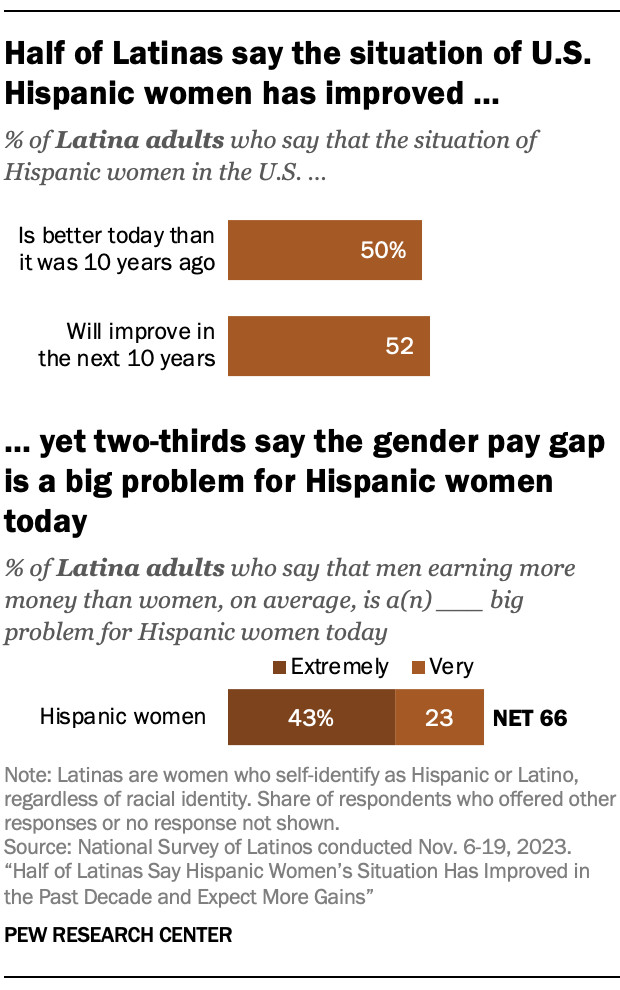
Still, 39% of Latinas say that the situation has stayed the same, and 34% say it will not change in the next 10 years. Two-thirds (66%) say the gender pay gap – the fact that women earn less money, on average, than men – is a big problem for Hispanic women today, according to new analysis of Pew Research Center’s National Survey of Latinos.
At 22.2 million, Latinas account for 17% of all adult women in the U.S. today. Their population grew by 5.6 million from 2010 to 2022, the largest numeric increase of any major female racial or ethnic group.1
Latinas’ mixed assessments reflect their group’s gains in education and at work over the last two decades, but also stalled progress in closing wage gaps with other groups.
- Hispanic women are more likely to have a bachelor’s degree today (23% in 2023) than they were in 2013 (16%). More Hispanic women than ever are also completing graduate degrees.
- Hispanic women have increased their labor force participation rate by 4 percentage points, from 65% in 2013 to 69% in 2023.
- The median hourly wage of Hispanic women has increased by 17% in the last decade. In 2023, their median hourly wage was $19.23, up from $16.47 in 2013 (in 2023 dollars).
Despite this progress, Hispanic women’s pay gaps with their peers haven’t significantly improved in recent years:
- The gender pay gap among Hispanics persists with no significant change. In 2023, Hispanic women earned 85 cents (at the median) for every dollar earned by Hispanic men, compared with 89 cents per dollar in 2013 (and 87 cents per dollar in 2003).
- Hispanic women continue to lag non-Hispanic women in earnings, with no significant improvement in the past decade. In 2023, the median Hispanic woman made 77 cents for each dollar earned by the median non-Hispanic woman, compared with 75 cents per dollar in 2013.
- The pay gap between Hispanic women and White men has changed only slightly. In 2023, Hispanic women earned 62 cents of every dollar earned by non-Hispanic White men, up from 59 cents per dollar in 2013.
In addition, Hispanic women lag Hispanic men and non-Hispanic women in labor force participation, and they lag non-Hispanic women in educational attainment. Read more in Chapter 2.
Among Latinas who are employed, about half (49%) say their current job is best described as “just a job to get them by.” Fewer see their job as a career (30%) or a steppingstone to a career (14%).
Pew Research Center’s bilingual 2023 National Survey of Latinos – conducted Nov. 6-19, 2023, among 5,078 Hispanic adults, including 2,600 Hispanic women – explores what it’s like to be a Latina in the U.S. today. This report uses findings from our 2023 survey as well as demographic and economic data from the Current Population Survey.
The following chapters take a closer look at:
- How Latinas view the progress and future situation of Hispanic women in the U.S.
- What government data tells us about Latinas’ progress in the labor market, earnings and educational attainment
- How Latinas’ educational and economic outcomes vary
For additional survey findings on what it means to be a Latina in the U.S. today and the daily pressures they face, read our report “A Majority of Latinas Feel Pressure To Support Their Families or To Succeed at Work.”


