Focus groups
Pew Research Center worked with PSB Insights to conduct six focus groups with a total of 27 transgender and nonbinary U.S. adults. The focus groups were conducted online from March 8 to March 10, 2022.
The focus groups included one group of transgender men, one group of transgender women, one group of nonbinary adults, and three groups with a mix of transgender and nonbinary adults. Each group included four or five participants, lasted for 90 minutes, and was led by an experienced moderator using a discussion guide developed by Pew Research Center. The discussion guide underwent Institutional Review Board review.
The transgender men group was moderated by a trans man; the transgender women group was moderated by a trans woman; the nonbinary group was moderated by a nonbinary moderator; two mixed groups were moderated by a trans man and one mixed group was moderated by a nonbinary moderator. The focus groups were conducted over a secure, online research platform with video and audio capabilities.
Recruitment efforts included targeted email outreach among a panel of qualified candidates, followed by a screening phone call with those who expressed interest over email to ensure they were eligible for the study. Additionally, some potential participants were found through professional networks and outreach to LGBTQ+ organizations. All participants were given financial remuneration for their time.
Participants had to meet four criteria to be eligible. First, potential participants had to be living in the United States and be at least 18 years old or the age of majority in their state. Second, they were screened to confirm that their gender was one of the following: transgender man, transgender woman, nonbinary, or some other gender that was not cisgender. Third, they had to have access to the internet and a device with a working webcam. And finally, participants had to be willing to attend the online focus group on a particular date and time. In order to ensure a diverse mix of participants among all who qualified, the research team also collected demographic information such as household income, education level, rurality, ethnicity, and race. See below for a demographic breakdown of the participants:

The findings are not statistically representative and cannot be extrapolated to wider populations.
Some quotes have been lightly edited for clarity or to remove identifying details. In this essay, participants are identified as trans men, trans women, or nonbinary adults based on their answers to the screening questionnaire. These words don’t necessarily encompass all of the ways in which participants described their gender. Participants’ ages are grouped into the following categories: late teens; early/mid/late 20s, 30s and 40s; and 50s and 60s (those ages 50+ were grouped into bigger buckets to better preserve their anonymity).
The following questions were used to determine whether respondents qualified to participate in the focus groups:
ASK ALL:
TECHACCESS Do you have access to a laptop, desktop computer or tablet to participate in the focus group?
1 Yes
2 No [THANK AND TERMINATE]
9 Don’t know/Refused (VOL.) [THANK AND TERMINATE]
ASK ALL:
CAMERATECH Does your laptop, desktop computer or tablet have a functioning webcam that is either built in or connected via USB?
1 Yes
2 No [THANK AND TERMINATE]
9 Don’t know/Refused (VOL.) [THANK AND TERMINATE]
ASK ALL:
INTERNET Do you have access to high-speed internet that can support streaming video?
1 Yes
2 No [THANK AND TERMINATE]
9 Don’t know/Refused (VOL.) [THANK AND TERMINATE]
ASK ALL:
BRWSERTECH Does your computer have one or more of the following internet browsers? Internet Explorer 11 or higher, Google Chrome, Mozilla Firefox, or Safari?
1 Yes
2 No [THANK AND TERMINATE]
9 Don’t know/Refused (VOL.) [THANK AND TERMINATE]
ASK ALL:
ENVIRONMENT During the focus group, we ask that you are in a quiet area so that we can have a discussion without any distractions, such as loud background noises or kids. Are you able to be in a quiet, non-distracting area during the duration of your focus group?
1 Yes
2 No [THANK AND TERMINATE]
9 Don’t know/Refused (VOL.) [THANK AND TERMINATE]
ASK ALL:
GENDERNEW Which of the following terms best describes your gender? Are you a man, a woman, nonbinary, or do you use another term that I haven’t mentioned? [IF R SAYS ANOTHER IDENTITY: What term do you use? ENSURE THEY ARE NOT GIVING A NON-SENSICAL OR MALICIOUS RESPONSE]
1 Man
2 Woman
3 Nonbinary
4 Another identity (Specify: ____)
9 Don’t know/Refused (VOL.)
ASK ALL:
TRANSNEW Do you consider yourself to be transgender?
1 Yes
2 No
9 Don’t know/Refused (VOL.)
If eligible so far, read:
Thank you for your responses thus far. The focus of the group discussion will be on gender identity. If you are eligible, you would be participating in a group with other individuals who are transgender or nonbinary.
ASK ALL:
GRPCOMFORT Would you be willing to participate in a group discussion on gender identity and share your experiences?
1 Yes
2 No [THANK AND TERMINATE]
9 [VOL. DO NOT READ] Don’t know/Refused
The American Trends Panel survey methodology
The estimate of the share of the U.S. adult population that is transgender or nonbinary, and the shares of the population that say they know someone who is transgender or nonbinary, come from a survey of the general public.
Overview
The American Trends Panel (ATP), created by Pew Research Center, is a nationally representative panel of randomly selected U.S. adults. Panelists participate via self-administered web surveys. Panelists who do not have internet access at home are provided with a tablet and wireless internet connection. Interviews are conducted in both English and Spanish. The panel is being managed by Ipsos.
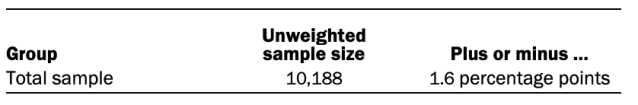
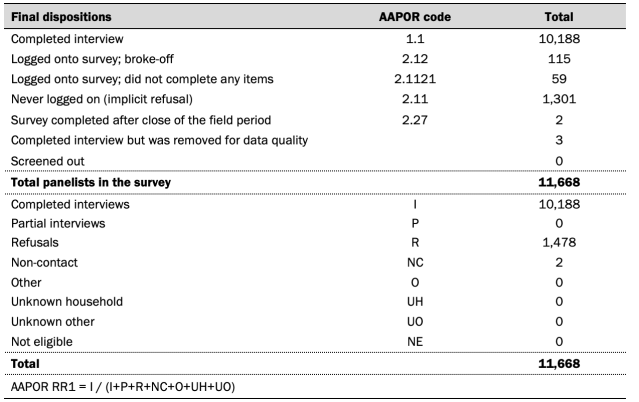
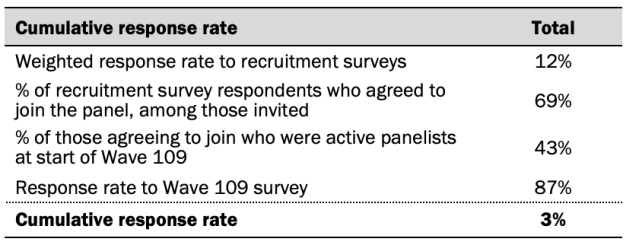
Data in this report is drawn from the panel wave conducted from May 16 to May 22, 2022. A total of 10,188 panelists responded out of 11,668 who were sampled, for a response rate of 87%. The cumulative response rate accounting for nonresponse to the recruitment surveys and attrition is 3%. The break-off rate among panelists who logged on to the survey and completed at least one item is 1%. The margin of sampling error for the full sample of 10,188 respondents is plus or minus 1.6 percentage points.
Panel recruitment
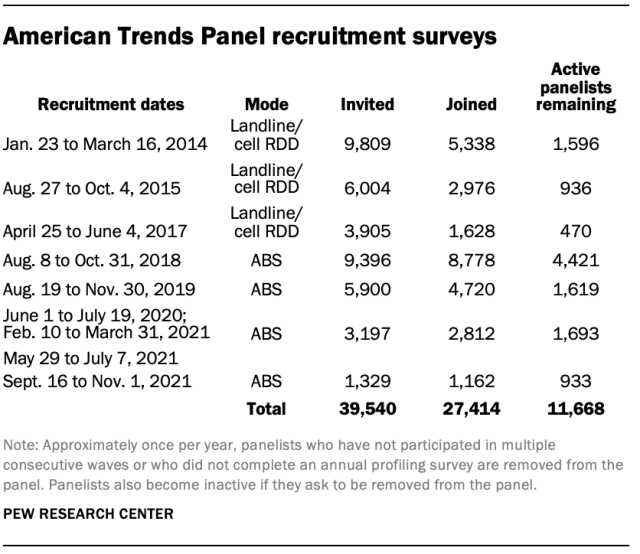
The ATP was created in 2014, with the first cohort of panelists invited to join the panel at the end of a large, national, landline and cellphone random-digit-dial survey that was conducted in both English and Spanish. Two additional recruitments were conducted using the same method in 2015 and 2017, respectively. Across these three surveys, a total of 19,718 adults were invited to join the ATP, of whom 9,942 (50%) agreed to participate.
In August 2018, the ATP switched from telephone to address-based recruitment. Invitations were sent to a stratified, random sample of households selected from the U.S. Postal Service’s Delivery Sequence File. Sampled households receive mailings asking a randomly selected adult to complete a survey online. A question at the end of the survey asks if the respondent is willing to join the ATP. Starting in 2020, another stage was added to the recruitment. Households that do not respond to the online survey are sent a paper version of the questionnaire, $5, and a postage-paid return envelope. A subset of the adults returning the paper version of the survey are invited to join the ATP. This subset of adults receive a follow-up mailing with a $10 pre-incentive and invitation to join the ATP.
Across the four address-based recruitments, a total of 19,822 adults were invited to join the ATP, of whom 17,472 agreed to join the panel and completed an initial profile survey. In each household, the adult with the next birthday was asked to go online to complete a survey, at the end of which they were invited to join the panel. Of the 27,414 individuals who have ever joined the ATP, 11,668 remained active panelists and continued to receive survey invitations at the time this survey was conducted.
The U.S. Postal Service’s Delivery Sequence File has been estimated to cover as much as 98% of the population, although some studies suggest that the coverage could be in the low 90% range.1
Sample design
The overall target population for this survey was non-institutionalized persons ages 18 and older, living in the U.S., including Alaska and Hawaii. All active panel members were invited to participate in this wave. The American Trends Panel never uses breakout routers or chains that direct respondents to additional surveys.”
Questionnaire development and testing
The questionnaire was developed by Pew Research Center in consultation with Ipsos. The web program was rigorously tested on both PC and mobile devices by the Ipsos project management team and Pew Research Center researchers. The Ipsos project management team also populated test data that was analyzed in SPSS to ensure the logic and randomizations were working as intended before launching the survey.
Incentives
All respondents were offered a post-paid incentive for their participation. Respondents could choose to receive the post-paid incentive in the form of a check or a gift code to Amazon.com or could choose to decline the incentive. Incentive amounts ranged from $5 to $20 depending on whether the respondent belongs to a part of the population that is harder or easier to reach. Differential incentive amounts were designed to increase panel survey participation among groups that traditionally have low survey response propensities.
Data collection protocol
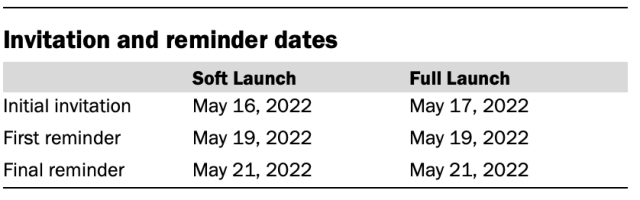
The data collection field period for this survey was May 16 to May 22, 2022. Postcard notifications were mailed to all ATP panelists with a known residential address on May 16, 2022.
Invitations were sent out in two separate launches: Soft Launch and Full Launch. Sixty panelists were included in the soft launch, which began with an initial invitation sent on May 16, 2022. The ATP panelists chosen for the initial soft launch were known responders who had completed previous ATP surveys within one day of receiving their invitation. All remaining English- and Spanish-speaking panelists were included in the full launch and were sent an invitation on May 17, 2022.
All panelists with an email address received an email invitation and up to two email reminders if they did not respond to the survey. All ATP panelists that consented to SMS messages received an SMS invitation and up to two SMS reminders.
Data quality checks
To ensure high-quality data, the Center’s researchers performed data quality checks to identify any respondents showing clear patterns of satisficing. This includes checking for very high rates of leaving questions blank, as well as always selecting the first or last answer presented. As a result of this checking, three ATP respondents were removed from the survey dataset prior to weighting and analysis.
Weighting
The ATP data is weighted in a multistep process that accounts for multiple stages of sampling and nonresponse that occur at different points in the survey process. First, each panelist begins with a base weight that reflects their probability of selection for their initial recruitment survey. The base weights for panelists recruited in different years are scaled to be proportionate to the effective sample size for all active panelists in their cohort and then calibrated to align with the population benchmarks in the accompanying table to correct for nonresponse to recruitment surveys and panel attrition. If only a subsample of panelists was invited to participate in the wave, this weight is adjusted to account for any differential probabilities of selection.
Among the panelists who completed the survey, this weight is then calibrated again to align with the population benchmarks identified in the accompanying table and trimmed at the 1st and 99th percentiles to reduce the loss in precision stemming from variance in the weights. Sampling errors and tests of statistical significance take into account the effect of weighting.
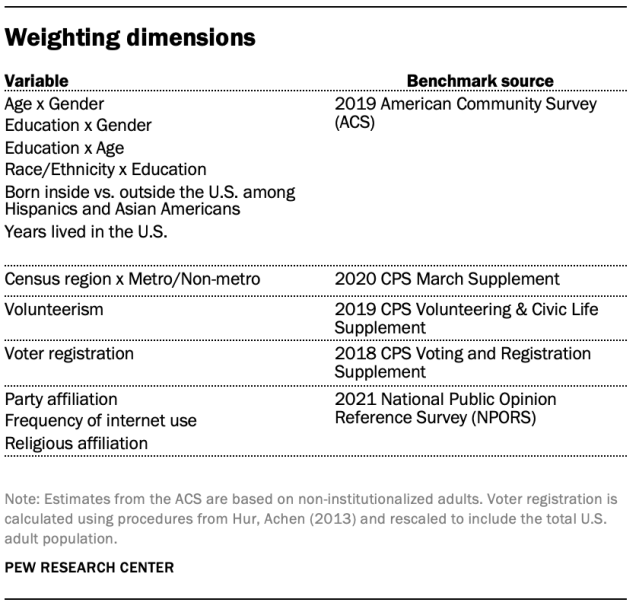
Some of the population benchmarks used for weighting come from surveys conducted prior to the coronavirus outbreak that began in February 2020. However, the weighting variables for panelists recruited in 2021 were measured at the time they were recruited to the panel. Likewise, the profile variables for existing panelists were updated from panel surveys conducted in July or August 2021.
This does not pose a problem for most of the variables used in the weighting, which are quite stable at both the population and individual levels. However, volunteerism may have changed over the intervening period in ways that made their 2021 measurements incompatible with the available (pre-pandemic) benchmarks. To address this, volunteerism is weighted using the profile variables that were measured in 2020. For all other weighting dimensions, the more recent panelist measurements from 2021 are used.
For panelists recruited in 2021, plausible values were imputed using the 2020 volunteerism values from existing panelists with similar characteristics. This ensures that any patterns of change that were observed in the existing panelists were also reflected in the new recruits when the weighting was performed.
The following table shows the unweighted sample sizes and the error attributable to sampling that would be expected at the 95% level of confidence for different groups in the survey.
Sample sizes and sampling errors for other subgroups are available upon request. In addition to sampling error, one should bear in mind that question wording and practical difficulties in conducting surveys can introduce error or bias into the findings of opinion polls.
Classification of transgender and nonbinary adults
Respondents were classified as transgender or nonbinary if they answered the sex and gender questions in any of the following ways:
1. If they said they describe themselves as nonbinary
2. If they said their sex assigned at birth was male and they describe themselves as a woman, and then confirmed that that was accurate in the GENDERCONFIRM question
3. If they said their sex assigned at birth was female and they describe themselves as a man, and then confirmed that that was accurate in the GENDERCONFIRM question
Write-in responses to the “in some other way” response option in the GENDERNEW question were backcoded so that write-in responses of “man” or “male” were categorized as “a man”; write-in responses of “woman” or “female” were categorized as “a woman”; and write-in responses of terms that may fall under the nonbinary umbrella, such as gender fluid and agender, were re-categorized as “nonbinary.” These respondents were then classified under the above rules.
The GENDERCONFIRM question is used to avoid misclassifying respondents who made an error when answering the sex or gender questions as transgender. This type of error can have an outsized effect on estimates of small populations such as the transgender and nonbinary population and make it appear larger than it really is and some federal surveys use this approach.
[DISPLAY SEX AND GENDERNEW ON THE SAME SCREEN]
DISPLAY TO ALL:
Now just a couple of questions for demographic purposes…
ASK ALL:
SEX What sex were you assigned at birth, on your original birth certificate? [RANDOMIZE RESPONSE OPTIONS]
1 Male
2 Female
ASK ALL:
GENDERNEW Do you describe yourself as a man, a woman, nonbinary or in some other way? [DISPLAY RESPONSE OPTIONS 1 AND 2 IN SAME ORDER AS SEX]
1 A man
2 A woman
3 Nonbinary
4 In some other way: [text box]
ASK IF SEX AND GENDERNEW DO NOT MATCH ((SEX=1 AND GENDERNEW=2) OR (SEX=2 AND GENDERNEW=1) OR (SEX=1 AND GENDERNEW=3) OR (SEX=2 AND GENDERNEW=3)):
GENDERCONFIRM Just to confirm, you were assigned [IF MALE AT BIRTH (SEX=1): male; IF FEMALE AT BIRTH (SEX=2): female] at birth and you describe yourself as [IF GENDER IS MAN (GENDERNEW=1): a man; IF GENDER IS WOMAN (GENDERNEW=2): a woman; IF GENDER IS NONBINARY (GENDERNEW=3): nonbinary]. Is that correct?
1 Yes
2 No
Dispositions and response rates
© Pew Research Center, 2022