Survey methodology
Most of the analysis in this report is based on telephone interviews conducted May 25 to June 29, 2016, among a national sample of 5,006 adults, 18 years of age or older, living in all 50 U.S. states and the District of Columbia (1,253 respondents were interviewed on a landline telephone, and 3,753 were interviewed on a cellphone, including 2,301 who had no landline telephone). The survey was conducted by interviewers at Princeton Data Source under the direction of Princeton Survey Research Associates International (PSRAI). Interviews were conducted in English and Spanish. For detailed information about our survey methodology, see https://www.pewresearch.org/methodology/u-s-survey-research/
A combination of landline and cell phone random digit dial (RDD) samples was used; both samples were provided by Survey Sampling International. Respondents in the landline sample were selected by randomly asking for the youngest adult male or female who was home at the time. Interviews in the cell sample were conducted with the person who answered the phone, if that person was an adult 18 years of age or older.
The combined landline and cell phone samples were weighted using an iterative technique that matches gender, age, education, race, Hispanic origin and nativity, and region to parameters from the Census Bureau’s 2014 American Community Survey and population density to parameters from the 2010 decennial census. The sample also was weighted to match current patterns of telephone status (landline only, cell phone only, or both landline and cell phone), based on extrapolations from the July-December 2015 National Health Interview Survey. The weighting procedure also accounts for the fact that respondents with both landline and cell phones have a greater probability of being included in the combined sample and adjusts for household size among respondents with a landline phone.
The margins of error reported and statistical tests of significance are adjusted to account for the survey’s design effect, a measure of how much efficiency is lost from the weighting procedures.
The following table shows the unweighted sample sizes and the error attributable to sampling that would be expected at the 95% level of confidence for different groups in the survey:

A second telephone survey was conducted Sept. 1 to 4, 2016, as part of the PSRAI September 2016 Week 1 omnibus. This survey was conducted among a nationally representative sample of 1,004 adults ages 18 or older living in the continental United States (503 respondents were interviewed on a landline telephone, and 501 were interviewed on a cellphone, including 294 who had no landline telephone). Interviews were conducted in English and Spanish. The margin of sampling error for the weighted data is ± 3.8 percentage points.
Sample sizes and sampling errors for other subgroups are available upon request.
In addition to sampling error, one should bear in mind that question wording and practical difficulties in conducting surveys can introduce error or bias into the findings of opinion polls.
Pew Research Center undertakes all polling activity, including calls to mobile telephone numbers, in compliance with the Telephone Consumer Protection Act and other applicable laws.
Coding of industries and occupations
Questions 20a and 20b in the main survey asked employed respondents what industry/field they work in and what kind of work they do (see topline for exact question wording and filters). These open-ended responses were coded using the net categories in the latest U.S. Census Bureau codes for industry and occupation, as reported by IPUMS.
Some industry and occupation codes were further collapsed into larger net categories as follows for analysis: The manufacturing and farming industry includes agriculture, farming, fishing, manufacturing, mining and construction. The trade industry includes retail and wholesale trade. The computer programming/IT industry includes software publishing, internet publishing and broadcasting, data processing and hosting, and computer systems design and related services. The hospitality/service industry includes arts, entertainment, social assistance, accommodation and food services, and all other personal services.
Manual/physical labor occupations include maintenance, installation, repair, production, machine operation, farming, fishing, forestry, construction and extraction. STEM/teaching occupations include computer programmers, coders, software developers, web developers, engineers, life, physical, and social science occupations, health care professionals, health care support occupations, teachers and instructors. Service occupations include food preparation and serving and personal care occupations.
Coding was conducted by PSRAI. The industry and occupation categories mentioned in the report are not exhaustive; only those with the largest shares of respondents are used in the analysis.
Analyses of secondary data
This section describes the data and methods used to measure the workplace trends presented in Chapter 1 of the report. A key aspect is the analysis of employment and wage trends in occupations grouped by job skills and preparation. That analysis is based on the combination of job skills and preparation data from the U.S. Department of Labor’s Occupational Information Network (O*NET) and occupational employment and wage data from the Current Population Survey (CPS).30 The CPS is also the data source for most of the other measures of workplace trends, such as health and retirement benefits, hours worked, job tenure, and self-employment.
Data sources
Occupational Information Network (O*NET): The O*NET database provides a variety of information related to the requirements of more than 950 occupations. Among other things, O*NET includes information on the specific skills required (mathematics, for example) by occupations, the more general abilities of workers in different occupations (such as stamina), the activities to be performed on the job (interacting with computers, etc.), and the job preparation required (a combination of education, experience and training.) A key piece of information is that each skill, ability or activity is rated on a scale of one to five measuring its importance to job performance, from not important to extremely important. Job preparation is also rated on a scale of one to five, from little or no preparation needed to extensive preparation needed. The ratings are based on ongoing surveys of a nationally representative sample of workers as well as occupation information generated by trained job analysts. This report used the most recent version of O*NET database available at the time (version 20.3, released April 2016). The ratings are mostly from within the past decade, reflecting the current level of importance of a skill to an occupation. Any change in these ratings over time is not observed in the current analysis. The occupations included in O*NET are classified according to a coding scheme that is consistent with the 2010 Standard Occupational Classification.
Current Population Survey (CPS): Conducted jointly by the U.S. Census Bureau and the Bureau of Labor Statistics, the CPS is a monthly survey of approximately 55,000 households and is the source of the nation’s official statistics on unemployment. In this report, 12 monthly CPS files in each year were combined to generate annual estimates of occupational employment in 1980, 1990, 2000, 2010 and 2015. Wages are estimated from the annual outgoing rotation group (ORG) files which consist of the sample of workers from whom wage information was collected. Additional analysis is based on the Annual Social and Economic Supplements (ASEC), conducted in March every year, and other relevant supplements to the CPS. Most of the CPS microdata files used in this report are the Integrated Public Use Microdata Series (IPUMS-CPS) provided by the University of Minnesota.31
Determining job skills and preparation
This report focuses on the changing demand for three major families of job skills – social, analytical and physical. In general terms, social skills include interpersonal skills, written and spoken communications skills, and management or leadership skills. Analytical skills pertain to facility with computers and mathematics, critical thinking and the like. Physical skills describe the ability to work with machinery or equipment, manipulate tools, and to do physical or manual labor.
Job skills and preparation from O*NET data
The table below lists the specific skills and work activities, from among the many listed in O*NET, chosen to represent the broader set of social, analytical and physical skills. Each major family of skills consists of sub-groups. Social skills refer to a combination of interpersonal skills, communication skills and managerial skills; analytical skills are a mix of critical thinking, evaluation and judgement skills, technical skills and basic computer skills; and physical skills are composed of mechanical skills and general physical skills. In turn, each sub-group consists of a handful of specific skills for which ratings are available in the O*NET data.
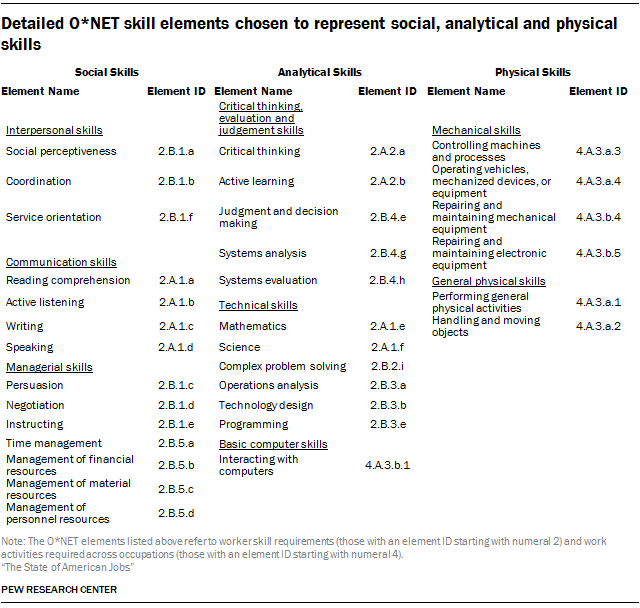
As noted, the importance of each skill to an occupation is given a numerical rating on a scale of one to five in the O*NET data. For example, chief executives (occupation code 11-1011.00) have an O*NET rating of 4.25 for social perceptiveness (element ID 2.B.1.a), 4.25 for coordination (element ID 2.b.1.b) and 3.12 for service orientation (element ID 2.B.1.f). The average of these three scores – 3.87 – is taken as the measure of the importance of interpersonal skills for chief executives. Similarly, the importance of communication skills is measured by the average of the O*NET rating for reading comprehension, active listening, writing and speaking skills. For chief executives, the average score on communication skills is 4.16. Managerial skills are rated by the average score on persuasion, negotiation, instructing, time management, and management of financial, material and personnel resources. The average score on managerial skills for chief executives is 3.94. Finally, the average of the scores for interpersonal, communication and managerial skills – 3.99 – is the overall social skill rating for chief executives.
The process described above is also used to develop the overall numerical rating for the importance of analytical skills and physical skills in each occupation. As the table shows, analytical skills are comprised of three sub-groups and physical skills are represented by two sub-groups. At the first stage, an average rating is estimated for each sub-group. Next, the average of the ratings for the sub-groups yields a measure of the overall importance of analytical and physical skills. For chief executives, the average importance of analytical skills is 3.70 and the average importance of physical skills is 1.34. The end result of this process is an average numerical rating for the importance of social, analytical and physical skills in each of the more than 950 occupations covered by O*NET.
The job preparation rating for an occupation is as directly recorded in O*NET in job zones. For example, chief executives have a numerical rating of five on job preparation (“extensive preparation needed.”) This rating means that the occupation typically requires a graduate school level of education and extensive skill, knowledge and experience.
Matching O*NET and CPS data
Because O*NET does not contain employment or wage information for occupations it is necessary to match the skills data to CPS data. Although both O*NET and the CPS use the 2010 standard occupational classification there is one key difference: O*NET lists more than 950 occupations coded at the eight-digit level, the finest detail possible, whereas the CPS lists fewer than 500 occupations coded at the four-digit level. In other words, an occupation listed in the CPS typically encompasses more than one occupation listed in O*NET. Thus, occupational data in O*NET must be aggregated to match up to the CPS data. This was done in three steps, as detailed below:
Step 1: The job skills and preparation ratings for eight-digit occupations in O*NET were aggregated to the six-digit level. For example, financial managers, a six-digit occupation, are broken apart into two eight-digit occupations in O*NET: treasurers and controllers and financial managers, branch or department. The job skills and preparation ratings for these two eight-digit occupations in O*NET were averaged to estimate the ratings for financial managers. This process was repeated as necessary and the end result was a set of numerical ratings on job skills and preparation for 772 six-digit occupations.
Step 2: The ratings for six-digit occupations were further aggregated to the four-digit level using an occupational crosswalk from the Bureau of Labor Statistics. For example, marketing and sales managers, a four-digit occupation, consists of the following two six-digit occupations: marketing managers and sales managers. In this step of the aggregation process, the job skills and preparation ratings for marketing managers and sales managers are averaged using the employment in each occupation as the weight. The result of this process was average jobs skills and preparation ratings for some 480 four-digit occupations that could be matched to the CPS.
Step 3: Because occupational classifications are frequently revised, an additional step was necessary to match the job skills and preparation ratings to a harmonized occupation coding scheme that could be used to trace employment and wage trends going back in time. This was done using the scheme available in the IPUMS-CPS data (OCC2010) that provides a consistent, long-term classification of occupations based on the 2010 standard occupational classification. Because of some inconsistencies between the latest CPS occupational codes and the harmonized occupation coding in OCC2010, additional aggregation and recoding was needed to maximize the number of occupations with valid skill ratings. For example, job skills and preparation ratings for advertising and promotions managers, marketing and sales managers, and public relations managers – three distinct four-digit occupations in the current CPS – were averaged using employment weights to estimate the ratings for managers in marketing, advertising, and public relations – a single occupation in the time-consistent OCC2010 classification. The final dataset with job skills and preparation data from O*NET includes 431 occupations, of which employment and wage data from the CPS were available for 430 occupations.
Sorting occupations by skill level and job preparation
Simple averages of the ratings for social, analytical and physical skills for the 431 occupations for which skills and preparation data could be tabulated are used to divide occupations into two groups, those with average to above average skill ratings and those with below average ratings.
In 2015, the average ratings across all occupations are estimated to be 2.96 for social skills, 2.79 for analytical skills, and 2.66 for physical skills. Occupations with a social-skills rating of 2.96 or higher (average to above average) are classified as requiring higher levels of social skills. Examples of such occupations are chief executives and registered nurses. Of the 430 occupations for which employment and wage data are also available, 206 were determined to require average to above average levels of social skills. Similarly, occupations with an analytical-skills rating of 2.79 or higher are classified as requiring higher levels of analytical skills. Numbering 228, this group includes occupations such as tax preparers. Occupations with a physical-skills rating of 2.66 or higher are classified as requiring higher levels of physical skills. There are 218 such occupations, such as welding, soldering and brazing workers.
It should be noted that an occupation may require higher levels of more than one type of skill. For example, being a chief executive requires both higher social and higher analytical skills. Among the 206 occupations requiring relatively higher levels of social skills, 180 also require higher levels of analytical skills. A table available for download provides a complete list of occupations showing whether or not they require higher levels of any of the three skills.
With respect to job preparation, the average rating across all occupations in 2015 is estimated to be 2.88. Jobs requiring this average level of preparation typically call for an associate’s degree or a similar level of vocational training, plus some prior job experience and one or two years of either formal or informal on-the-job training (e.g., electricians). Occupations with a job preparation rating of 2.88 or higher are classified as requiring higher levels of job preparation.
Hourly wages
Estimates of hourly wages encompass all workers from whom wage data were collected in the CPS, whether or not the workers were paid on an hourly basis. For workers who are not paid by the hour, the hourly wage is calculated as weekly earnings divided by the usual numbers of hours worked in a week. Wage estimates pertain to a worker’s main job. The CPS collects data on wages from outgoing rotation groups only, which represent one-quarter of the monthly sample. Self-employed workers are excluded from this sub-sample. Wages are adjusted for inflation with the Consumer Price Index Research Series (CPI-U-RS).
Pew Research Center is a nonprofit, tax-exempt 501(c)(3) organization and a subsidiary of The Pew Charitable Trusts, its primary funder.