
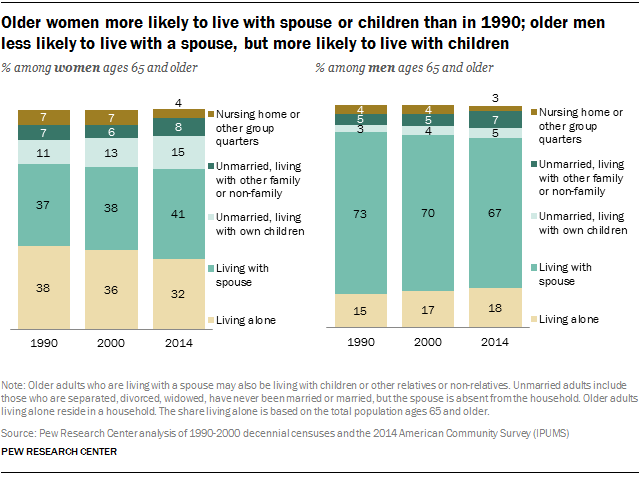
The share of older Americans living with their spouse has increased modestly since 1990, reaching 53% in 2014. This increase has been driven mostly by older women, as older men are less likely to live with their spouses (and be married) today than in 1990. Fully 41% of older women lived with their spouse in 2014 – up from 37% in 1990.
Even so, older men remain considerably more likely than older women to live with their spouse. In 2014, 67% of older men lived with their spouse (down somewhat from 73% in 1990). At the same time, the share of older adults who are divorced (and have not remarried) has grown since 1990.
Older unmarried women and men are increasingly likely to live with their own children. But older women are nearly three times as likely to do so as older men. In 2014, 15% of older women were unmarried and living with their children, compared with 5% of older men. Since 1990, this share has increased by 3 percentage points for women and 2 points for older men.
The increase in older unmarried adults living with their children is part of a larger trend in the rise of multi-generational households – and one that has fueled the decline in older adults living alone since 1990. 9 However, the increase in this living arrangement in recent years has largely been driven by young adults, ages 25 to 34.
The share of unmarried older adults living with relatives (other than children) or non-relatives has also grown slightly, from 6% in 1990 to 8% in 2014. Some of these unmarried older adults may be cohabiting with a partner – a growing trend among adults ages 65 and older. As of 2014, 2% of non-institutionalized adults ages 65 and older were unmarried and living with a partner. 10
Among older men, the share who are unmarried and living with other relatives or non-relatives rose to 7% in 2014 – up from 5% in 1990. The share of women living in this arrangement rose to 8% in 2014 from 7% in 1990.
Living arrangements of older adults differ sharply by age and gender
The trends in living arrangements of men and women differ greatly between those ages 65 to 84 and those 85 and older. The share of adults ages 85 and older living in nursing homes or other group quarters has declined substantially – one of the most notable trends in the living arrangements of older Americans. In 1990, about a quarter of women ages 85 and older (27%) lived in these types of living arrangements. By 2014, some 13% of women in this age group did so. Among men ages 85 and older, the share living in a nursing home has declined from 17% in 1990 to 8% in 2014.
This has been replaced by a variety of other arrangements, including living alone or with a spouse or children. Trends for those ages 65 to 84 are largely similar to those noted for all adults ages 65 and older in the previous section.
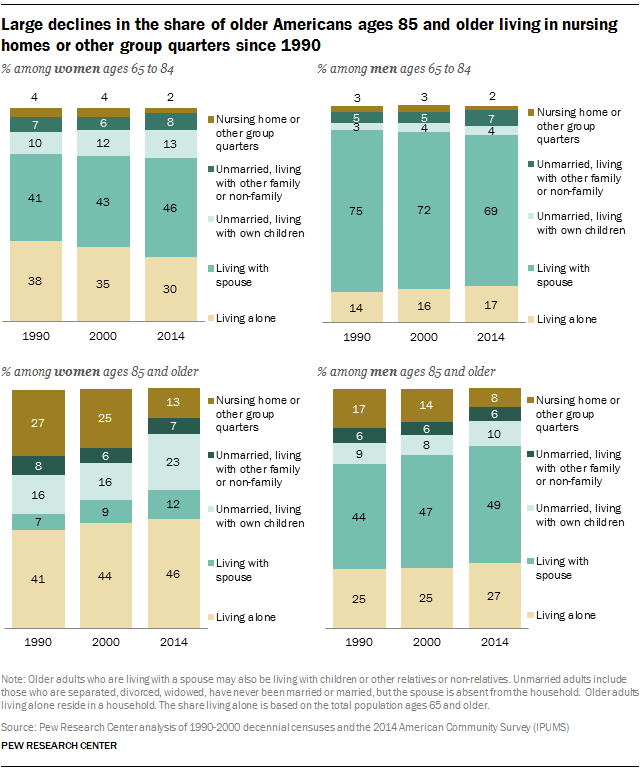
While the share of women living with a spouse has increased for both age groups, the share doing so among women ages 85 and older nearly doubled in recent decades. In 2014, 12% lived with their spouse – up from 7% in 1990. Despite this, the share of women ages 85 and older living with a spouse is substantially smaller than that of any other age and gender group.
The overall decline in men living with their spouse is driven by men ages 65 to 84. Roughly seven-in-ten men in this age group (69%) lived with a spouse in 2014 – down from 75% in 1990. Men ages 65 to 84 are more likely than in 1990 to be divorced and slightly more likely to never have been married. (See appendix table for more details on marital status by age and gender.) Conversely, men ages 85 and older are more likely to live with their spouse (and be married) in 2014 than in the prior decades. Among men ages 85 and older, about half (49%) lived with a spouse in 2014, compared with 44% in 1990. While there are growing shares of men ages 85 and older who are divorced, this share has risen less sharply than that of men ages 65 to 84.
Women ages 85 and older were considerably more likely to live with their children in 2014 than in the previous two decades. Roughly a quarter (23%) of women ages 85 and older were unmarried and lived with their children in 2014, compared with 16% in 1990. A considerably smaller share of men in this age range (10%) were unmarried and living with their children in 2014. This was a slight increase from 9% in 1990.


