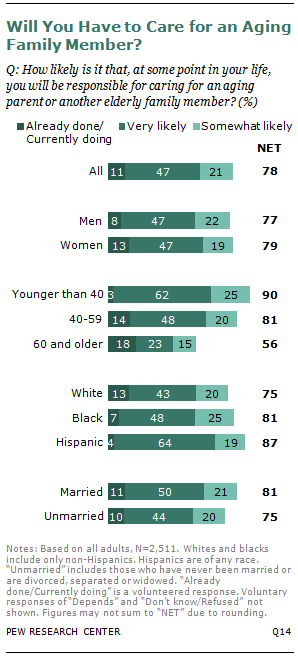
In addition to financial support, many middle-aged adults are providing other types of care to their aging parents. And if they are not caring for their parents now, most expect they will be in the future. The Pew Research survey finds that 14% of adults in their 40s and 50s have already cared for an aging parent or other elderly family member, and nearly seven-in-ten say that it is “very” (48%) or “somewhat” (20%) likely they will have to do this in the future.
Those in their 50s (17%) are more likely than those in their 40s (9%) to have already cared for a family member. But the share of those in their 40s who say it is very or somewhat likely they will have to in the future (78%) significantly exceeds the share of adults in their 50s who say the same (59%).
Nearly two-in-ten adults ages 60 and older (18%) say they have already cared for an aging family member, but relatively few in comparison to younger adults think they will have to in the future (38% say it’s very or somewhat likely). Among adults ages 60 and older, only 20% still have a living parent, so many know with certainty that they will not be caring for a parent.
Among adults younger than 40, the exact opposite is the case. Only 3% have already performed this duty, about six-in-ten (62%) think it is very likely they will have to in the future, and a quarter think it is somewhat likely. Women (13%) are more likely than men (8%) to have already cared for an aging family member, while a roughly equal share of women (66%) and men (69%) expect they will in the future. Whites are the oldest of the major racial and ethnic groups, so unsurprisingly they are also the most likely to have already cared for an older family member. While 13% of whites say they have done this, smaller shares of blacks (7%) and Hispanics (4%) say they have. But Hispanics are the most likely of these groups to expect to care for an aging family member in the future (64% say it is very likely, compared with 48% of blacks and 43% of whites).
Married people (70%) are slightly more likely than those who are not married (65%) to say they expect to care for an aging family member in the future, perhaps because of the presence of parents-in-law in addition to their own parents. There are no significant differences in the share of married and unmarried people who say they have already cared for an aging family member.
Among middle-aged adults (those ages 40 to 59), some 14% say they have cared for an aging family member in the past or that they are currently doing so. An additional 68% say it is very or somewhat likely that they will have this responsibility in the future.
Not surprisingly, the older one’s parents are, the more likely they are to have already taken an aging family member into their care. About two-in-ten middle-aged adults with at least one parent age 80 or older have a history of caregiving (21%). This share is only 9% among those whose parents are ages 65 to 79. But three-quarters of middle-aged adults with parents ages 65 to 79 expect to care for give aid to an older family member at some point.
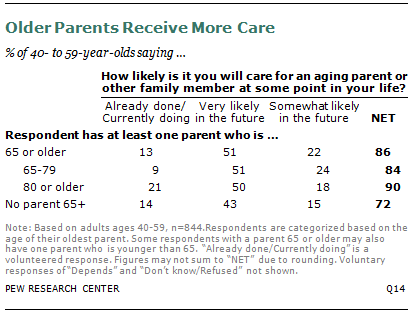
Adults in their 40s and 50s who do not have a parent age 65 or older (that is, their parents are either younger than 65 or no longer living) are equally likely as those with one or more parents ages 65 and older to have cared for an aging family member in the past but are significantly less likely to say it is likely they will have to do so in the future (58% vs. 73%).
According to data from the Bureau of Labor Statistics, 16% of all Americans ages 15 and older (including 23% of Americans ages 45 to 64) provided some level of unpaid care to an adult age 65 or older in 2011. More than four-in-ten eldercare providers (42%) were caring for a parent. The majority of caregivers were women (56%), and a quarter (23%) of the men and women providing care were parents with at least one child younger than 18 in their household.6
Does Your Parent Need Help?
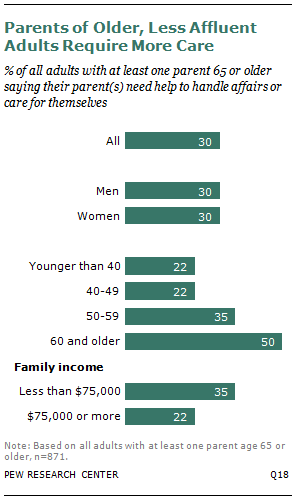
Among adults with at least one parent age 65 or older, three-in-ten say their aging parent or parents need help to handle their affairs or care for themselves, while 69% say their parents can handle these things on their own.
Age is a huge factor in parents’ independence, as younger adults are more likely to have younger parents. While 28% of all middle-aged adults have a parent who needs help, the share is significantly higher among those in their 50s (35%) than among those in their 40s (22%). In this measure, adults in their 40s closely resemble adults younger than 40. Among adults ages 60 and older with living parents, half say their parents need help with day-to-day activities. However, a smaller share of these adults have living parents (20%, compared with 63% of adults in their 50s and 93% of adults younger than 50).
Adults with annual family incomes less than $75,000 are more likely than those with higher incomes to say they have parents who need help (35% vs. 22%), even when retirees (who are likely to have lower incomes and older parents) are removed from the equation.
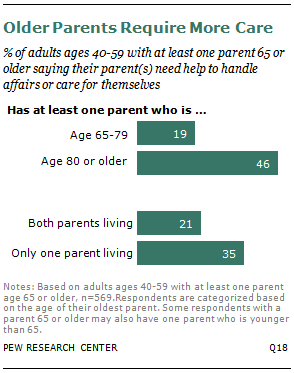
The share of adults ages 40 to 59 who say their parent needs help varies greatly by the age of their parents as well. Among those with at least one parent age 80 or older, nearly half (46%) say they have a parent who needs care. Among adults with at least one aging parent younger than 80, less than half that share (19%) say the same.
Additionally, the need for practical care is lower when both parents are living (21%) than when only one parent is living (35%), though this may be related to the age of the parent in addition to the lack of a companion.
Who Provides Most of the Help?
Among all adults with an aging parent who say their parent or parents need care, 31% say they provide most of the help, 39% say someone else in the family does it, and 14% say most of the care is managed by paid help or assisted living facilities.
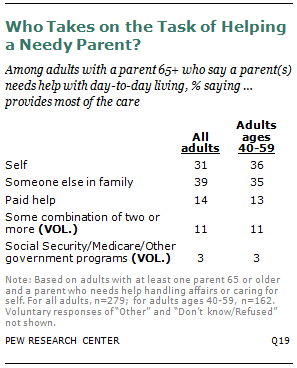
About six-in-ten (62%) adults with parents who require practical assistance are ages 40 to 59 (14% are younger, 23% are older). Among these middle-aged adults, about one-third (36%) say they provide most of the help. Another third say someone else in the family provides this help (35%), and one-in-ten say the parent has paid help (13%). One-in-ten (11%) volunteer that it is some combination of two or more of these things, and 3% volunteer that government programs provide most of the assistance.
Among middle-aged members of the sandwich generation with a parent who needs care, about three-in-ten (29%) say they are providing most of the care. About four-in-ten (38%) say someone else in the family is caring for their parent, and 15% say the parent has paid help. Some 12% say it is some combination of these things.
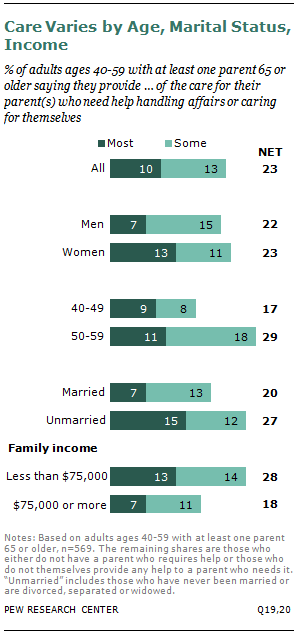
In all, one-in-ten adults in their 40s and 50s with a parent age 65 and older are providing primary care for a parent. This compares with 5% of younger adults and 14% of older adults.
Respondents who said they did not provide most of the care were then asked if they provided any of the care to a parent who needs it. In addition to the 36% of middle-aged adults who say they provide most of the help to a parent who requires care, 45% say they provide some of it.
This means that about a quarter (23%) of all adults in their 40s or 50s who have at least one parent age 65 or older (regardless of whether that parent needs assistance) are providing at least some day-to-day assistance to a parent.7 The share of adults in their 50s who are caregivers to an aging parent (29%) is significantly higher than the share in their 40s (17%), due in large part to the overall older age of their parents.
There are some differences in the shares of adults who provide most or some of the care to their aging parent or parents.8 Women are more likely than men to be providing primary care to an aging parent (13% vs. 7%). And those who are not married (15%) are more likely than those who are married (7%) to provide most of the care to a parent. However, there are no differences between men and women or between married and unmarried individuals in the shares who provide at least some care.
Individuals with family incomes below $75,000 are more likely to provide most or some of the help to a needy parent than those with higher incomes (28% vs. 18%), a trend that exists even among the non-retired.


