American Community Survey and Decennial Census
Analysis of the new marriages and currently married population are mainly based on the most recent American Community Survey (ACS) data as well as a three-year (2008-2010) combined ACS data set on the couple level, constructed by the Pew Research Center.
The American Community Survey is a household survey developed by the U.S. Census Bureau to replace the long form of decennial census program. It is collected throughout the year using mailed questionnaires, telephone interviews, and visits from Census Bureau field representatives to about 3 million household addresses annually.
[Machine-readable database]
Married Population: The currently married population is selected as individuals whose marital status is “married, spouse present.” The spouse must be present in the data set to ascertain his/her race, Hispanic origin and nativity. In these data sets all married couples consist of a man and a woman. The unit of analysis in this report is the couple. The IPUMS database includes linkages of spouse records and supplies “attached variables” that place the value for the spouse’s variable on each record. Thus, by selecting only records of married, spouse present males (or females) and “attaching” values of all variables for the spouse, we constructed a data set where each record represents a married couple and the data set includes all married couples in the sample. For the analyses in the current study, we included attached variables such as the spouse’s age, race, Hispanic origin, nativity, year of immigration, other social and economic variables and weighting information.
Newly Married Population: The newly married population is a subset of the currently married population drawn from ACS 2008 and later. The 2008 ACS was the first to include questions relating to date of marriage. One question asked respondents if they had been married (or divorced or widowed) in the “past 12 months.”1 Those saying they had married are the basis for the analyses of “newlyweds” and “new marriages” in this report. Further questions asked how many times the respondent has been married and in what year the most recent marriage occurred. To increase the sample size of subgroups, analyses of characteristics of newlyweds in this report were based on combined three-year data (2008-2010) for newlyweds.
A Note on Historical Intermarriage Trend: Because the information on new marriages is available only starting in the 2008 ACS, historical comparisons of new marriage or intermarriage rates can be challenging. Using unique information provided by the 1980 Census, we were able to estimate the newly married population in 1980, although the definition of “newly married” is slightly different.
The 1980 Census asked respondents if they had been married once or more than once, the month and year of marriage (first marriage in the case of multiple marriages), and if the first marriage had ended by the death of the other spouse. With this information, we derived the year in which the first marriage occurred and identified persons whose first marriage occurred in the year before the 1980 Census. The newly married couples for 1980 reported here consist only of those marriages in which either the bride or groom was marrying for the first time, since marriages in which both spouses had been married more than once could not be assigned a year of marriage (around 10% of the married population). While this means that the 1980 data do not include all new marriages that year, it is not likely to have a significant impact on the comparisons presented between rates of intermarriage in 1980 and the present. About 90% of the married population in 1980 included one or both spouses in a first marriage, and the intermarriage rates for those in first marriages differed little from all married persons.
Weighting and Other Technical Issues: All of the estimates for marriages, currently married population and people getting married are based on weighted data from the IPUMS microdata files. The Census Bureau provides the weights based on a complicated weighting process so that the resulting estimates reflect the actual population. In the data from the 1980 Census, the weights for each person in a husband-wife couple are forced to be equal. This is not the case for the data files from the ACS or the 1990 and 2000 Censuses. Consequently, the number and characteristics of wives estimated using their husbands’ weights will be different from the same estimates based on the wives’ weights; similarly for characteristics of men estimated from their wives’ weights. For this report, we created a “couple weight” as the average of the husband’s weight and the wife’s weight (similar to the 1980 Census process). This weight is used in all ACS analyses to ensure that the number of husbands equals the number of wives.2
In processing the ACS data for this report, we identified a small percentage of couples (less than 0.1% in each year) in which the year of marriage reported by the husband differed from the wife’s report. In an even smaller share of cases (less than 0.01% each year or about 50 unweighted couples), the linkages supplied by IPUMS appear to have linked the wrong individuals in households with two or more married couples, based on reported year of marriage. In the data used for this report, these few cases have been corrected.3
Race and Ethnic Groups: Individuals are identified as Hispanic or non Hispanic with a direct question on Hispanic origin. The wording and placement of the question have changed somewhat over the 1980-2010 period, but the underlying concept has remained essentially unchanged. Individuals who are not Hispanic are further subdivided by race group. Throughout the period of analysis, we use data for whites, black, Asians and Pacific Islanders4 (“Asians”), American Indians and Alaska natives (“American Indians”) and a residual category usually labeled as “Some Other Race.”
Beginning with the 2000 Census, individuals could choose to identify with more than one group in response to the race question; about 4.6 million non-Hispanics, or slightly less than 2% of the non-Hispanic population, chose more than one race. We treat these people as an additional racial grouping and reserve the specific races listed above for persons identifying as a single race only. This change in data collection methods may have accounted for a significant share of the increase in intermarriage observed in the currently married population between 1990 and 2000. In the 2000 Census, about 720,000, or 19% of the 3.8 million marriages with spouses of a different race, were between a non-Hispanic person reporting a single race and a non-Hispanic person reporting more than one race. Had the race question remained the same as in 1990, some of these interracial marriages in 2000 would not have been so classified. This type of marriage accounted for almost half of the increase in interracial marriages between 1990 and 2000. In 2008, roughly the same number of interracial marriages, about 700,000, were between single- and multiple-race non-Hispanics. They represent a somewhat smaller share (15%) of the 4.6 million interracial marriages in 2008.
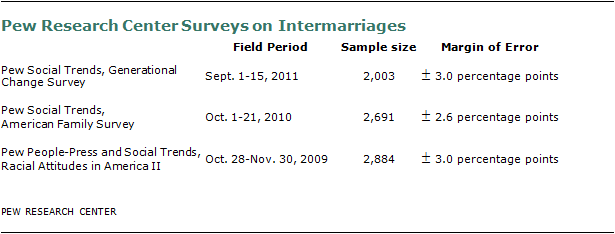
Public Opinion Surveys
The survey findings presented in this report are based on a series of Pew Research Center national telephone survey of adults conducted on landlines and cell phones. Major surveys used are shown below.