Frustration has long been Americans’ dominant emotion toward the federal government.
Source: Survey of U.S. adults conducted Sept. 22-28, 2025. Trend data: Pew Research Center’s American Trends Panel (2020-25), Pew Research Center phone surveys (2019 and earlier).
| Date | Angry | Frustrated | Basically content |
|---|---|---|---|
| Oct ’97 | 12 | 56 | 29 |
| Feb ’00 | 10 | 54 | 33 |
| Nov ’01 | 8 | 34 | 53 |
| Mar ’04 | 13 | 52 | 32 |
| Oct ’06 | 20 | 54 | 21 |
| Sep ’10 | 23 | 52 | 21 |
| Aug ’11 | 26 | 60 | 11 |
| Oct ’13 | 30 | 55 | 12 |
| Feb ’14 | 19 | 62 | 17 |
| Oct ’15 | 22 | 57 | 18 |
| Mar ’16 | 21 | 57 | 20 |
| Dec ’17 | 24 | 55 | 17 |
| Mar ’19 | 21 | 57 | 18 |
| Aug ’20 | 24 | 57 | 18 |
| Apr ’21 | 17 | 52 | 29 |
| May ’22 | 18 | 60 | 22 |
| Jun ’23 | 21 | 59 | 18 |
| May ’24 | 21 | 60 | 18 |
| Sep ’25 | 26 | 49 | 23 |
Source: Survey of U.S. adults conducted Sept. 22-28, 2025. Trend data: Pew Research Center’s American Trends Panel (2020-25), Pew Research Center phone surveys (2019 and earlier).
We regularly ask Americans whether the federal government makes them feel basically content, frustrated or angry. Today, 49% say they feel frustrated. Another 26% say they are angry, and 23% say they are basically content, according to a Pew Research Center survey of 3,445 U.S. adults conducted Sept. 22-28 (just before the 43-day government shutdown).
Interactive: Public Trust in Government, 1958-2025
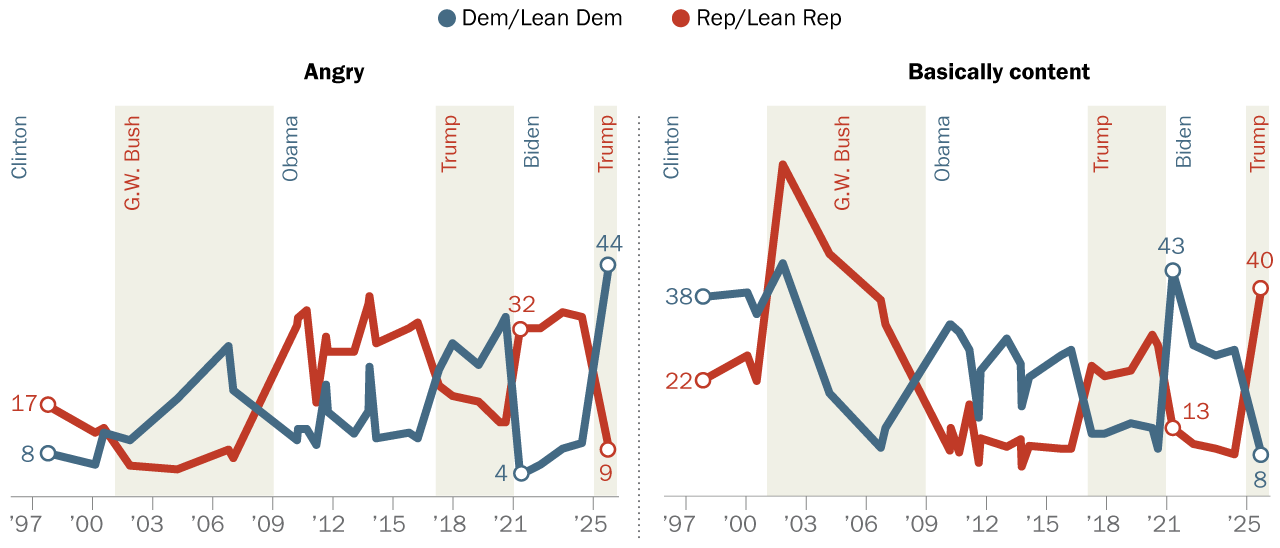
Frustration is common across the political spectrum regardless of which party holds the presidency. But the shares of Republicans and Democrats feeling anger and contentment shift dramatically depending on who’s in the White House.
Still, the partisan gaps in these views are wider now than at any point since we first asked this question in 1997. The share of Democrats who are angry toward the federal government has hit a new high:
- 44% of Democrats and Democratic-leaning independents say they feel angry
- 47% say they are frustrated
- 8% say they are basically content
Source: Survey of U.S. adults conducted Sept. 22-28, 2025. Trend data: Pew Research Center’s American Trends Panel (2020-25), Pew Research Center phone surveys (2019 and earlier).
| Date | Rep/Lean Rep (Angry) | Dem/Lean Dem (Angry) | Rep/Lean Rep (Basically content) | Dem/Lean Dem (Basically content) |
|---|---|---|---|---|
| 2025-09-28 | 9 | 44 | 40 | 8 |
| 2024-05-19 | 34 | 10 | 8 | 28 |
| 2023-06-11 | 35 | 9 | 9 | 27 |
| 2022-05-01 | 32 | 6 | 10 | 29 |
| 2021-04-21 | 32 | 4 | 13 | 43 |
| 2020-08-02 | 14 | 34 | 29 | 9 |
| 2020-04-12 | 14 | 32 | 31 | 13 |
| 2019-03-25 | 18 | 25 | 24 | 14 |
| 2017-12-04 | 19 | 29 | 23 | 12 |
| 2017-04-11 | 21 | 24 | 25 | 12 |
| 2016-03-26 | 33 | 11 | 9 | 28 |
| 2015-10-04 | 32 | 12 | 9 | 27 |
| 2014-02-26 | 29 | 11 | 10 | 23 |
| 2013-10-13 | 38 | 25 | 6 | 17 |
| 2013-09-29 | 37 | 16 | 11 | 25 |
| 2013-01-13 | 27 | 12 | 9 | 30 |
| 2011-10-04 | 27 | 16 | 11 | 24 |
| 2011-08-21 | 30 | 21 | 6 | 15 |
| 2011-03-01 | 18 | 10 | 18 | 28 |
| 2010-09-06 | 35 | 13 | 8 | 31 |
| 2010-04-05 | 34 | 13 | 13 | 33 |
| 2010-03-21 | 32 | 11 | 9 | 33 |
| 2007-01-09 | 7 | 20 | 33 | 13 |
| 2006-10-04 | 9 | 29 | 38 | 9 |
| 2004-03-21 | 5 | 18 | 47 | 20 |
| 2001-11-19 | 6 | 11 | 64 | 45 |
| 2000-07-28 | 13 | 12 | 22 | 35 |
| 2000-02-14 | 12 | 6 | 27 | 39 |
| 1997-10-31 | 17 | 8 | 22 | 38 |
Source: Survey of U.S. adults conducted Sept. 22-28, 2025. Trend data: Pew Research Center’s American Trends Panel (2020-25), Pew Research Center phone surveys (2019 and earlier).
In contrast, 40% of Republicans and Republican leaners say they are basically content. Half express frustration, and just 9% say they feel anger.
Democrats’ anger is higher now than during Republican President Donald Trump’s first term, when a peak of 34% expressed anger. It’s also the highest share expressed by members of either party in surveys dating back to 1997.
Republican anger peaked during the administrations of Democratic Presidents Joe Biden (35%) and Barack Obama (38%).
GOP contentment is higher now than at any point in the previous Trump administration, and the highest share since Republican George W. Bush’s first term. It’s also on par with previous Democratic peaks.
These dynamics echo shifts in Americans’ trust in the federal government:
- Democrats’ trust in the federal government to do the right thing (9%) has never been lower over the nearly 70 years polling organizations have asked this question.
- 26% of Republicans trust the federal government to do the right thing all or most of the time. That’s on par with views during Trump’s first term and up from 11% a year ago.
For more on trust in the federal government over the last 70 years, please visit our interactive.
Note: Here are the questions used for this analysis, the topline and the survey methodology.
