

It may be true, as Benjamin Franklin wrote toward the end of his life, that “in this world, nothing is certain except death and taxes.” But while we’re all in the 100% death bracket, the federal income tax’s impact on Americans is considerably more variable – depending on one’s income level, source of income, marital status, age, residence, homeownership, parenthood and many other factors.
The American tax system manages to combine ubiquity, complexity and opacity. With the 2023 tax season nearing its end, Pew Research Center analyzed IRS data to shed light on a poorly understood topic.
The IRS, by the nature of its mission, collects copious data on Americans’ financial lives. It makes much of that data available through its Statistics of Income program. We concentrated most of our research on the individual income tax – the federal government’s single largest revenue source, and what most people tend to associate with “paying my taxes.” (That said, for millions of middle- and lower-income Americans, the payroll taxes that fund Social Security and Medicare take a bigger bite out of their gross income than income taxes do. Nor did we attempt to quantify the relative incidence of state and local taxes, such as sales tax and property tax.)
The IRS data we used was derived from a stratified probability sample of all individual income tax returns filed in a given year. IRS researchers then weighted the sample data for each stratum, or subpopulation, to reflect the total number of returns in it. (The strata were defined not only by income, but also by such factors as the presence or absence of special forms or schedules.)
In most cases the IRS breaks down its estimates into 18 groups by adjusted gross income, or AGI, plus a 19th group with no AGI. For much of our analysis, we combined the IRS’s AGI categories into eight larger groups, which made some underlying trends easier to see. Along with the IRS data, we relied on the Office of Management and Budget for historical data on the share of federal receipts from various sources.
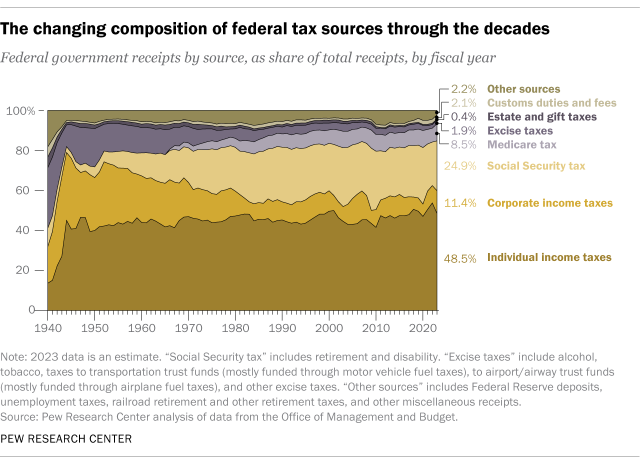
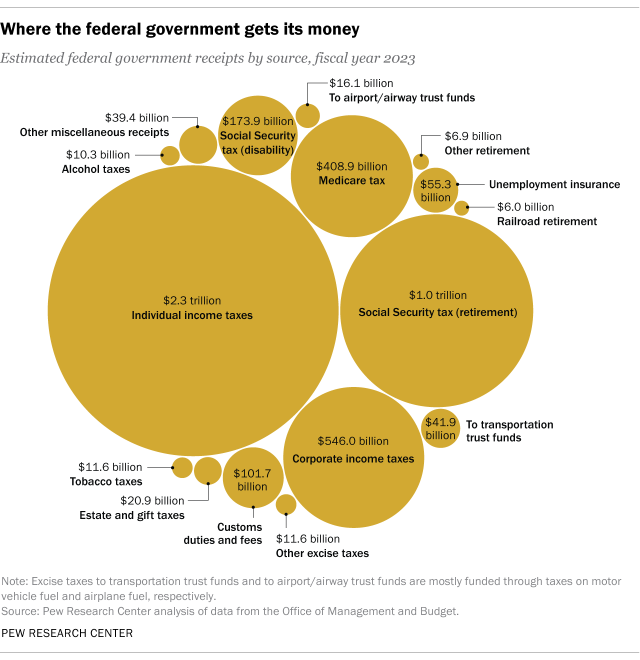
All told, the federal government expects to collect about $2.33 trillion in individual income taxes this year, accounting for nearly half (48.5%) of its total receipts, according to the Office of Management and Budget. The IRS expects more than 168 million individual tax returns to be filed this year; if previous years’ patterns continue, about two-thirds of those returns will show some taxable income.
Taken as a whole, the federal income tax is progressive, meaning that those with higher incomes pay at higher rates. But the system’s progressivity tends to break down at the very uppermost income levels.
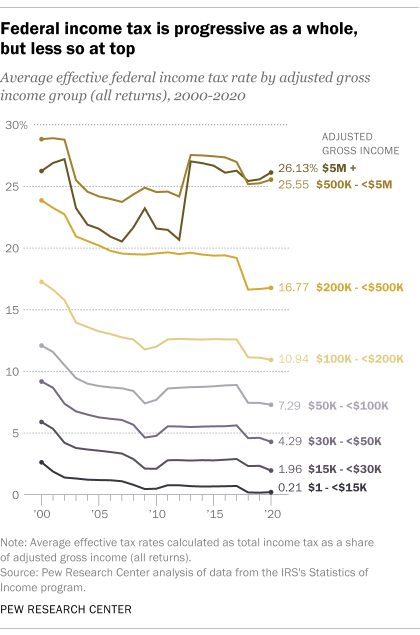
In 2020, the most recent year for which the IRS has detailed data, all groups of taxpayers with $1 million or more in adjusted gross income (AGI) had average effective tax rates of more than 25%.
Average effective tax rates, defined here as total income tax as a percentage of AGI, were highest among taxpayers with AGIs between $2 million and $10 million (nearly 28%). The average effective tax rate for taxpayers with AGIs of $10 million or more was actually a bit lower (25.5%), mainly because they tend to get more of their income from dividends and long-term capital gains, which are taxed at lower rates than wages, salaries and other so-called “ordinary income.”
At the other end of the income scale, tens of millions of Americans owed little or no federal income tax, especially after factoring in the effects of refundable tax credits, such as the child and earned-income credits.
In 2020, the IRS received nearly 5.3 million individual tax returns that showed no AGI and hence no taxable income. (About 4,600 of those people ended up paying tax anyway, mainly due to the alternative minimum tax.) Another 60.3 million returns showed AGIs of less than $30,000. The average effective tax rate for those taxpayers was 1.5%, even before refundable tax credits were applied.
Millions of Americans actually get money from the IRS, largely due to refundable tax credits. (This is distinct from the refunds eagerly awaited by legions of taxpayers, which typically result from more tax being withheld from people’s paychecks than they end up owing.)
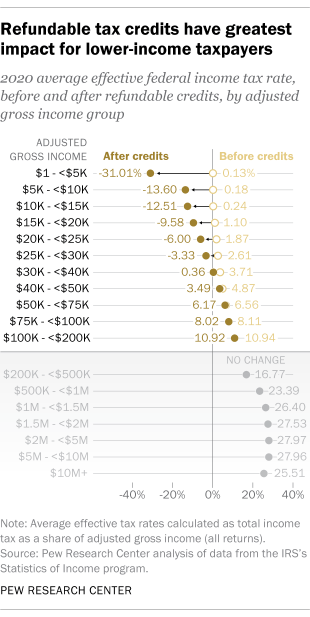
Credits are used to offset taxes owed – not only income tax but certain other taxes, too, such as the self-employment tax or the penalty tax on early withdrawals from qualified retirement plans. But if the value of refundable tax credits exceeds total taxes owed, the excess can be paid out to the taxpayer. This primarily benefits people with lower incomes.
After refundable credits were figured in, taxpayers with AGIs below $30,000 (including those with no AGI or with negative AGI) collectively got back more than $78.6 billion from the IRS in 2020. For taxpayers with AGIs between $1 and $15,000, their average effective tax rate fell to ‑14.8%, from ‑10.3% in 2019, largely due to coronavirus pandemic-related federal relief efforts, some of which were structured as tax credits.
Since 2000, there has been a downward trend in average effective tax rates for all but the richest taxpayers – those with AGIs of $10 million or more. But the three major tax law overhauls during this period have affected different classes of taxpayers quite differently:
- The Bush tax cuts of 2001 and 2003 benefited the highest-income taxpayers the most. Those with AGIs of $5 million or more saw their average effective tax rate drop from 27.2% in 2002 to 23.2% in 2003. Taxpayers with AGIs between $500,000 and $5 million saw their average effective rates fall from 28.8% to 25.5%. Other taxpayers with lower incomes experienced much smaller rate cuts.
- In 2013, by contrast, two provisions aimed squarely at higher-income taxpayers kicked in. A new net investment income tax and Medicare surtax, enacted to help pay for the Affordable Care Act (“Obamacare”), helped raise the average effective tax rate on the highest-earning taxpayers (those with AGIs of $5 million or more) from 20.7% in 2012 to 27% the following year. Those with AGIs ranging from $500,000 to under $5 million also saw their average effective tax rate increase, from 24.2% to 27.5%, while other groups experienced little to no change.
- The Trump tax cuts of 2017, which altered provisions throughout the tax code, had their biggest impact on upper-middle-income taxpayers: those with AGIs of at least $200,000 but less than $500,000. Although average effective tax rates fell for all income groups, they fell the most for that upper-middle group, from 19.2% in 2017 to 16.6% in 2018.
Besides average effective tax rates, another way to look at the relative burden on different groups of taxpayers is by examining how much of the total bill they foot.
The IRS collected $1.66 trillion in individual income taxes in 2020 (excluding the $78.6 billion in negative tax liabilities referred to earlier). Close to 54% of that sum came from taxpayers with AGIs between $100,000 and $1 million – a group that accounted for just under a fifth of all returns filed (31.3 million), and about 30% of all taxable returns (31 million).
At the very top of the income ladder, only 0.02% of all returns filed in 2020 showed AGIs of $10 million or more, but those taxpayers collectively paid $210.2 billion in taxes after refundable tax credits, or 12.6% of total individual income tax collections.
Corporate tax brings in smaller share of federal revenues
Although the focus this time of year is on individual income taxes, corporate income taxes are also a significant source of federal revenue. This year, the Office of Management and Budget projects that the government will collect $546 billion in corporate taxes, or 11.4% of estimated total receipts. That’s less than half the corporate-tax share of total revenues that prevailed in the 1950s.
Several big corporations, including Amazon, Nike and FedEx, have come under fire in recent years for paying little to no income tax. But comparing corporate and individual income taxes is tricky. For one thing, corporations can report income and taxes differently to the IRS than they do publicly to investors. They can also spread losses in a given year across several years’ worth of taxes – meaning, in effect, that taxes due on this year’s profits can be offset by a previous year’s losses.
Also, some types of business income generally aren’t taxed through the corporate income tax at all. Sole proprietorships, partnerships and entities called “S corporations” pass their income (or loss) through to their owner or owners, who include it in their individual taxes. In 2020, 9 million taxpayers reported income or losses from partnerships and S corporations, and 27.7 million reported income or losses as sole proprietors or self-employed professionals.
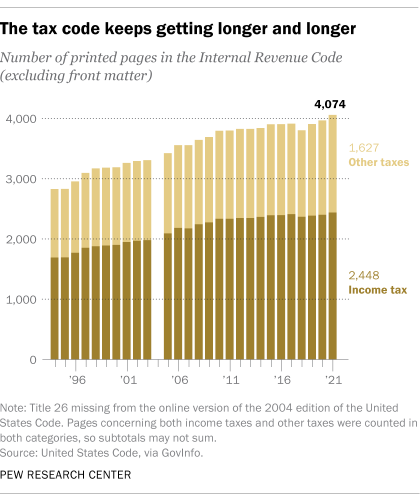
The rules governing what constitutes business or individual income, and how it should be taxed, are only part of what makes the U.S. tax code as complex as it is. One rough measure of that complexity: The printed version of the 2021 edition of the Internal Revenue Code runs a total of 4,074 pages, excluding front matter. More than half of those pages (2,448) are devoted to the income tax alone.
The tax code’s complexity is one of the biggest things Americans dislike about it. In a recent Pew Research Center survey, 53% of U.S. adults said the system’s complexity bothered them a lot. Larger shares, however, said they were bothered a lot by the feeling that some corporations and wealthy people don’t pay their fair share of taxes (61% and 60%, respectively). By contrast, 38% said they were bothered a lot by the amount they personally paid.
