
The U.S. Hispanic population reached 62.1 million in 2020, an increase of 23% over the previous decade that outpaced the nation’s 7% overall population growth. At the county level, growth played out unevenly, which resulted in the continued geographic spread of Hispanics. Numerical growth of Hispanics was largest in counties that already had significant Hispanic populations, but the growth rate was largest in counties with smaller Hispanic populations, according to a Pew Research Center analysis of decennial census data from 1980 to 2020.
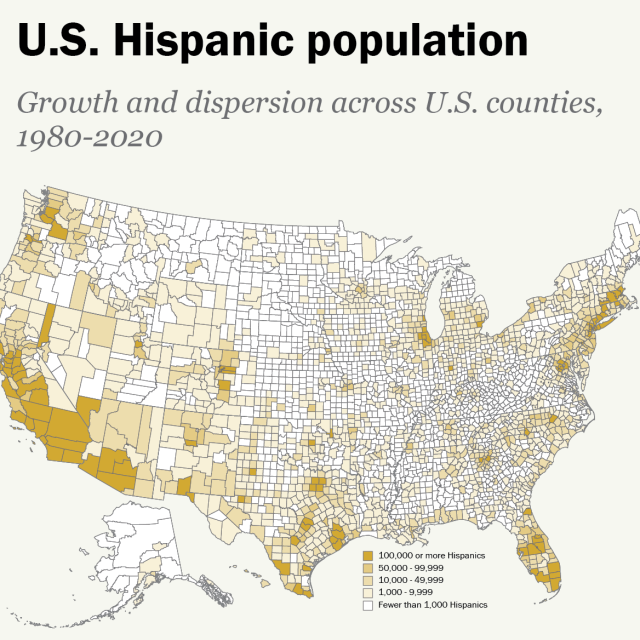
Hispanic Population Growth and Dispersion Across U.S. Counties, 1980-2020
Check out our interactive on Hispanic population growth.
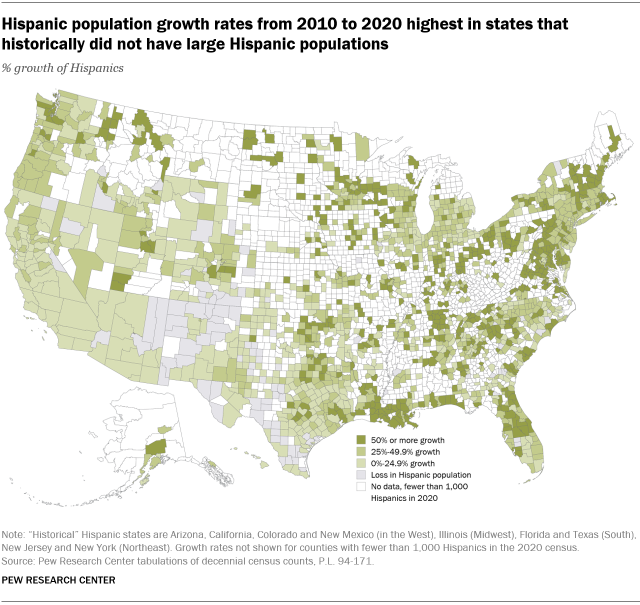
The Hispanic population grew by 50% or more from 2010 to 2020 in 517 of the 1,685 counties with 1,000 or more Hispanics in the 2020 census. The vast majority of these counties are not in what have historically been Hispanic population centers. Together, these counties have a Hispanic population of only 7.6 million. By contrast, the 20 counties with the largest numerical growth in population are home to more than a third of the nation’s Hispanics (22.2 million).
The U.S. Latino population has been shifting away from states with historically large Latino populations for decades, a trend that can be seen at the state level. As recently as 1990, 86% of Latinos lived in just nine states (Arizona, California, Colorado, Florida, Illinois, New Jersey, New Mexico, New York and Texas). Although the Latino population has grown in each of these states, their share of all U.S. Latinos had dropped to 73% by 2020. In New Mexico, the state’s 1 million Latinos are nearly half of the population (48%). Despite a large population share, New Mexico, which had the ninth-largest Latino population in 2010, dropped to 13th-largest in 2020, after being passed by Georgia, North Carolina, Washington and Pennsylvania.
As part of our ongoing research on Hispanics in the United States, we analyzed how this group’s geographic dispersion has changed over four decades, 1980-2020, using census counts from this period’s five decennial censuses. The principal data sources are the redistricting data or Public Law 94-171 Summary files, the first subnational data released from each decennial census since 1980. These datasets provide information from the complete census counts for major races by Hispanic origin for adults and children that cover every census block in the country. We used data on the total U.S. and Hispanic populations summarized to the county level from these data files for 2020, 2010, 2000 and 1990; for 1980, we used STF1a data files which include the same information as the P.L. 94-171 files plus additional demographic detail.
The analysis focuses on several dimensions of Hispanic population and change: Hispanic population size; share of the county’s population that is Hispanic; growth rate of the Hispanic population; and the role of Hispanics in population change for each county. For all of these except the growth rate of the Hispanic population, our analysis uses all counties in the U.S. However, in analyzing county growth rates for Hispanics, we included only those counties with at least 1,000 Hispanics in the 2020 census, because growth rates based on small populations can overemphasize growth in these areas. Further, the measurement of growth for small populations between 2010 and 2020 has added uncertainty due to the Census Bureau’s new “differential privacy” disclosure avoidance procedure that increases the potential for error in measuring small populations and small changes.
The U.S. is divided into counties or county equivalents for political and administrative purposes and for the census. In 47 states, the county-equivalent entities are counties; in Louisiana, they are designated as parishes; Virginia has both counties and independent cities; Alaska has boroughs, census areas, municipalities and cities; and the entire District of Columbia is treated as a single county. We use the term “county” to refer to these county-equivalent entities.
One issue that we faced is that the boundaries and names of some counties have changed over time: New counties are created, and some counties are eliminated or combined with others. To provide consistent comparisons of county populations across censuses, we made some modifications to the counties defined at the time of each census. That is why our dataset includes 3,140 counties instead of the 3,143 counties for which 2020 census data is available. We refer to the counties by the names and official FIPS (Federal Information Processing Series) codes used in 2020, with the exception of several areas in Alaska. Read details on how we defined a consistent set of 3,140 counties across the five censuses, 1980-2020.
Largest numerical gains occurred in counties with large Hispanic populations
Among all 3,140 counties in 2020 defined for our analysis, the Hispanic population grew in 2,823 and declined in 309. The 10 counties that gained the most Hispanics from 2010 to 2020 were mainly large metropolitan counties in the South and West, regions that have had significant Hispanic populations for many decades. They included three counties each in Florida and Texas, two in California, one in Arizona and one in Illinois. (Here are details of how counties were defined for the 1980-2020 censuses.)
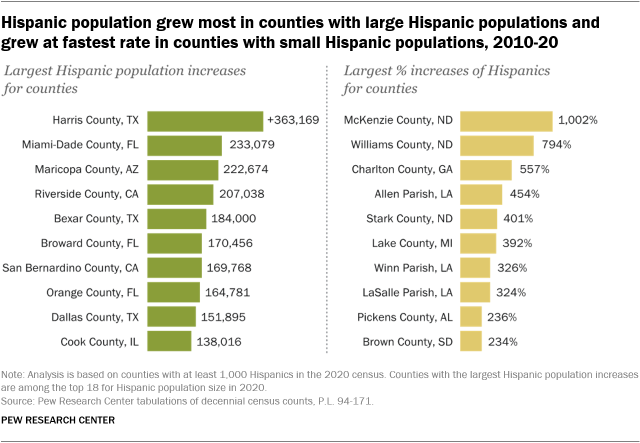
Hispanic numbers grew by 363,000 in Houston’s Harris County over the past decade, more than in any other county. That increase was larger than the Hispanic populations in 23 states and the District of Columbia. The counties with the largest Hispanic population growth also are among the top 18 for counties for Hispanic population size in 2020.
But growth rates were highest from 2010 to 2020 in counties located in states with smaller Hispanic populations. Among counties with 1,000 Hispanics in 2020, the top 10 Hispanic growth rates ranged from 234% to 1,002% – at least 10 times the national growth rate of Hispanics. There are three in Louisiana, three in North Dakota, and one each in Alabama, Georgia, Michigan and South Dakota. North Dakota, the state with the fastest Hispanic population growth (148%), has the two fastest-growing counties: McKenzie (+1,002%) and Williams (+794%). They are among the top oil-producing counties in the country and were the two fastest-growing counties for total population between 2010 and 2020, in part due to job growth.
Several of these smaller but fast-growing counties in the South, notably Charlton County, Georgia, and LaSalle Parish, Louisiana, have private prisons that serve as federal immigration detention centers. Detainees held in these facilities on April 1, 2020, are counted as part of the county’s population. Since many of the detainees are from Latin American countries, they would likely be considered Hispanic and would contribute to the county’s Hispanic growth.
Fewer counties with rapid Hispanic population growth
Substantially fewer counties had fast-growing Latino populations than in previous decades, which reflects the slowing of nationwide Latino population growth. The Latino population grew by 50% or more in 517 counties between 2010 and 2020, half the number of the previous decade (1,040) and fewer than the 1990s (840).
Over the past decade, 100 counties with at least 1,000 Latinos in 2020 showed Latino population losses, a substantially higher number than in previous censuses. Nearly all these counties are located in the South (54) or West (40) in states with historically high Latino populations. Only six counties that lost Latino population are in the Northeast or the Midwest. Notably, they include New York County (Manhattan), where the Latino population declined by 937 out of a total of more than 400,000. All the declines in Latino populations were of fewer than 2,500 people.
Declines in the Hispanic population may be due in part to factors other than actual population change, including potential population undercounts and Census Bureau alterations in how numbers are edited and reported. To protect respondents’ privacy, the Census Bureau applied a new disclosure avoidance procedure known as “differential privacy” to the 2020 census data. This involves adding “statistical noise” – or variations from the actual count – to the raw demographic data for individual census blocks. While the Census Bureau acknowledges this can lead to published results for individual blocks that “may not seem correct,” the effect on accuracy should generally be small when blocks are aggregated into larger areas, such as counties. Even so, there remains the possibility of error, particularly for small subpopulations and measurements of small differences and changes. In addition, Census Bureau officials say that changes in question wording and data-editing procedures also affected the reported numbers and made them not fully comparable to those from earlier counts.
Los Angeles County has largest Hispanic population
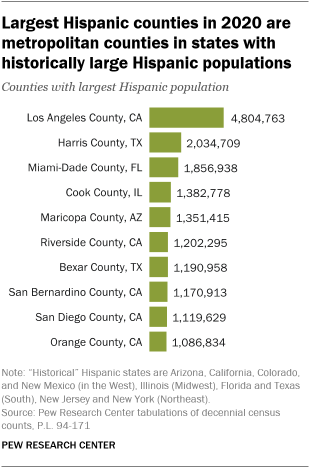
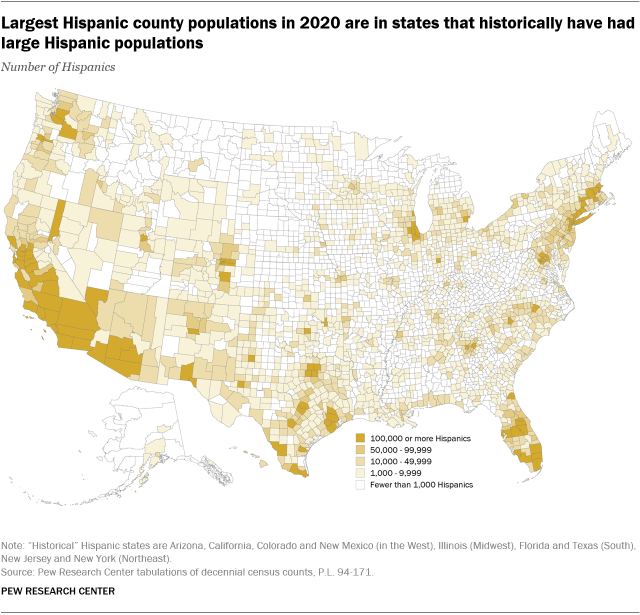
Los Angeles County has the nation’s largest Hispanic population, a distinction it has held since the census first included a Hispanic category in 1980. Los Angeles County has more than 4.8 million Hispanics – more than any state except California, Texas and Florida – and they account for almost half of the county’s population.
The top 10 counties for Hispanic population in 2020 remain the same as in 2010, including five in California, but some counties moved up or down in the rankings. Most dramatically, Riverside County, California, ranked sixth in 2020 but ninth in 2010, and Orange County, California, ranked 10th in 2020 and sixth in 2010.
As the Hispanic population has grown, an increasing share of Hispanics live in counties with large Hispanic populations, compared with several decades ago. Seven-in-ten Hispanics (70%) live in counties with Hispanic populations of 100,000 or more, a small uptick from 2010 (69%) but a substantial increase from 1980 (58%).
Hispanics make up the majority of 101 county populations
Among all 3,140 counties in 2020, Latinos accounted for a quarter or more of the total population in 311, including 101 where they were the majority. These majority-Latino counties include 87 in states bordering Mexico and some in other states such as Miami-Dade, Florida (57%), and Bronx, New York (55%).
The number of counties that were at least 25% Latino increased from 259 in 2010; these include 82 counties where Latinos were a majority of the population that year. A rising share of all Latinos – 61% in 2020, up slightly from 59% in 2010 – live in counties where Latinos are at least a quarter of the population. Nationally, Latinos made up 19% of the U.S. population in 2020.
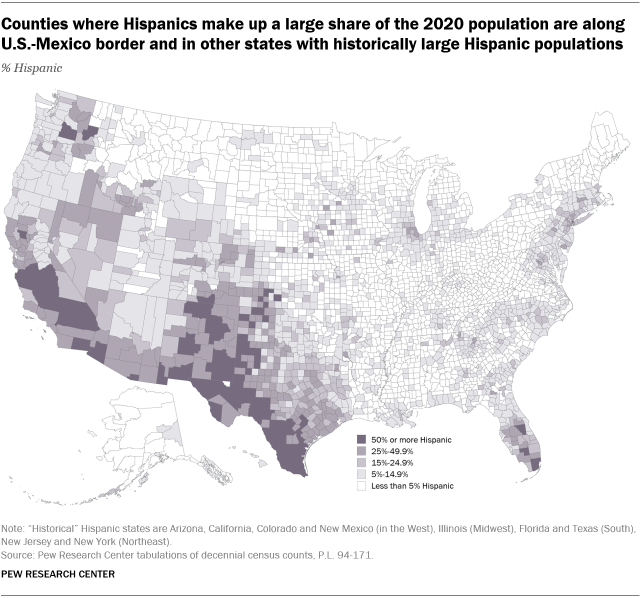
Between 2010 and 2020, 22 counties became majority Hispanic, and three went from majority Hispanic to less than 50% Hispanic. The new majority-Hispanic counties include 12 relatively small counties in Texas as well as four counties with populations that exceed 250,000 – Kern, California (55% Hispanic), San Bernardino, California (54%), Osceola, Florida (54%), and Yakima, Washington (51%). The three counties that lost their Hispanic majority include Santa Fe, New Mexico (48%), and two small counties in Texas.
At the other extreme, Hispanics were less than 5% of the total population in 1,668 counties of the nation’s 3,140. A declining share of the nation’s Hispanics – only 3% in 2020, down from 5% in 2010 – live in counties where Hispanics are less than 5% of the total population. The number of counties with this small share of Hispanics declined from 1,990 in 2010.
Hispanics drive population growth in some of the nation’s largest counties
Nationally, Hispanics accounted for 51% of the nation’s population increase, a higher share than any other racial or ethnic group. At a more local level, Hispanic population growth often played a major role in whether a county’s population grew and by how much, though the impact varied widely.
In 590 of the 3,140 counties in 2020, Hispanic population growth accounted for at least 50% of total population growth. They include some counties with sizable Hispanic populations, such as Los Angeles County, and tend to be larger than other counties. On average, their total populations were 226,000 people, compared with the national average of 106,000 among all counties.
In 289 of these 590 counties, all of the population growth was due to Hispanics. That is, the non-Hispanic population declined, but the Hispanic growth more than offset this drop so that the county’s total population increased. These include San Bernardino and several other counties in interior California. They also include prominent counties elsewhere such as Cook (Illinois); New Haven and Hartford (Connecticut); Providence (Rhode Island); Suffolk (New York); and Miami-Dade (Florida).
Both the Hispanic and non-Hispanic populations grew in the remaining 301 counties where Hispanics accounted for at least 50% of total growth. This group includes counties with some of the nation’s largest Hispanic populations, including Los Angeles (California); Harris (Texas); Broward (Florida); and Bronx (New York).
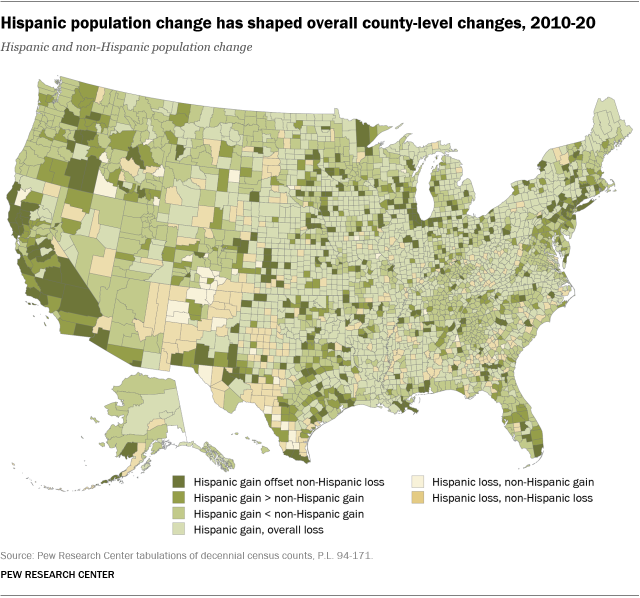
In two large groups of counties, the Latino population increased from 2010, but growth in the non-Latino population determined whether the county’s total population grew. In 1,361 counties, the total population declined despite growth in the Latino population. The bulk of these are in the Midwest (601 counties) and the South (583 counties), especially in Southern states that historically have not had large Latino populations. In 873 counties, both the Latino and non-Latino populations went up, but the Latino population rose less sharply and accounted for less than half of population growth. Most of these counties are located in states that historically have not had large Latino populations and include a large swath across the South (352) and Midwest (214).
In the remaining 309 counties the Latino population declined from 2010 to 2020; 269 of these had declines in their non-Latino population as well, according to census data. The other 40 counties had gains in their non-Latino populations; the overall population grew in 26 of these. With the exception of New York County, which saw an overall population growth, these tend to have relatively small populations.


