This section describes the methods used to estimate religious composition at the country level, regionally and globally; our procedures for measuring religious groups’ demographic characteristics and their religious “switching” rates; as well as methodological challenges that we considered in some countries. The final section lists the 201 countries and territories that make up each of the six regions in our analysis.
This work was a collaboration between researchers at Pew Research Center and the Center for Advanced Studies of Population and Religion (CASPAR) at Krakow University of Economics.
How did you measure religious composition?
This report focuses on seven broad categories – Christians, Muslims, Hindus, Buddhists, Jews, adherents of other religions and religiously unaffiliated people. The “other religions” category includes Baha’is, Daoists (also spelled Taoists), Jains, Shintoists, Sikhs, Wiccans, Zoroastrians and many small groups, some of which can be described as folk or traditional religions. The religiously unaffiliated population – sometimes called “nones” – includes people who in surveys and censuses answer a religious affiliation question by saying they do not identify with any religion or that they are atheist or agnostic.
Censuses and surveys collect religious identity at different levels of specificity. For example, depending on the source, the most specific level of affiliation measured for a Southern Baptist could be Christian, Protestant, Baptist or Southern Baptist. Researchers coded all religious identities into the seven categories used in this report.
We rely on how people describe their own religious identity. Religious identity doesn’t line up perfectly with belief or practice. If someone identifies with a religious group, we classify them as part of that group regardless of their beliefs and practices. If someone self-identifies as Christian, we classify them as Christian whether or not they hold orthodox Christian beliefs or attend worship services. Similarly, if someone says they identify with no religion, we classify them as religiously unaffiliated even if they hold religious beliefs and attend worship services.
Most of our data comes from census and survey questions that measure religion using a direct question like “What is your religion, if any?” Direct, one-step measures of religious identity are more widely used than two-step measures that first ask a filter question such as, “Do you belong to a religion or religious denomination?”39
Sources used to measure religious composition
We use more than 2,700 data sources in this study. These sources include censuses; large-scale demographic surveys, which often survey more than 10,000 people; general population surveys, which typically survey 1,000 to 3,000 people; information from population registers; the World Religion Database; and government reports. For more information, read Appendix A.
As our team of demographers considered which sources to use in each country, we evaluated characteristics of the sources, including how they measured religious identity, how samples were drawn, the mode of data collection, the size of samples, and estimates of the size of groups across sources and across waves of surveys that were repeated.
We sought sources that collected data close to 2010 and 2020 using sound methods and robust samples. As much as possible, we wanted to maximize the comparability of sources across time periods within each country and to have similar types of sources within countries.
The countries and territories for which we used census data to estimate religious composition comprised 44% of all people in 2010 and 42% in 2020. Large-scale demographic surveys, including Demographic and Health Surveys (DHS), were our primary sources for 8% of the world’s people in 2010 and 10% in 2020. We used general population surveys to measure 44% of the world’s population in both 2010 and 2020.
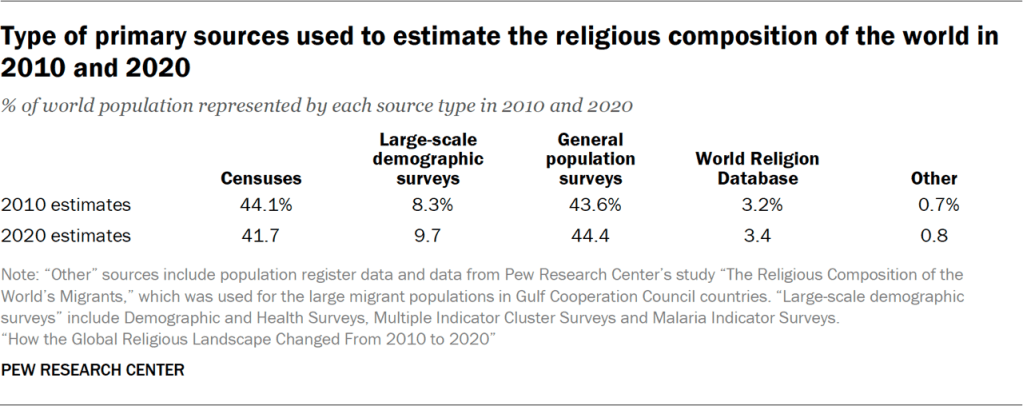
The places for which we used World Religion Database (WRD) estimates as our primary source are home to 3% of the world’s people. Among the many types of information used to create WRD estimates are statistics gathered from religious communities and assessments from country experts. This type of information is especially valuable for countries like Cuba and North Korea, which have little or no publicly available, nationally representative survey data on religious composition.
For countries and territories home to less than 1% of the world’s people, we used a different kind of primary source. For Finland and Israel, we used data from population registers maintained by the governments of those countries (in Israel, religion data from the population register is merged into census reports). In Gulf Cooperation Council (GCC) countries, we relied on the estimates produced for our 2024 Center report “The Religious Composition of the World’s Migrants” to describe the religious makeup of migrants. Migrants made up about half of the region’s overall population as of 2020.
Special procedures for estimating the size of small religious groups
When religious groups make up a small share of a population, they are not necessarily measured reliably in surveys. For example, some immigrant populations may be underrepresented if they are not fluent in the languages in which a survey is conducted or because they are concentrated in refugee camps or other areas outside a survey’s sampling frame. Alternatively, a religious group with only a few thousand members in a country of many millions may not be reliably detected in a typical survey.
We consulted a range of sources to refine our estimates when some of the seven groups in our study made up a small share of a population. These sources include the World Religion Database, the religious demography sections of International Religious Freedom Reports from the U.S. State Department, the Yearbook of Muslims in Europe, and world Jewish population estimates published in annual editions of the American Jewish Year Book.
In some Western European countries, we used surveys to measure the religious composition of the native-born population combined with a separate procedure to estimate the religious composition of the foreign-born population. Our foreign-born population estimates frequently rely on estimates we made for the 2024 Center report “The Religious Composition of the World’s Migrants.” Read that report’s Methodology for details on how migrant religious composition estimates were made.
Children’s religion
While censuses often provide religion information on people of all ages, most surveys provide information on the religious composition only of adults. When primary sources provide direct information only about adult religious composition, we use indirect demographic estimation methods for the religious composition of children. For example, in many countries we use information about the age structure and fertility rates of women in different religious groups to estimate the proportion of each religious group in the child population. This approach assumes that children share their mother’s religion.
Using surveys of people of reproductive age to make general population estimates
Some demographic surveys, such as the Demographic and Health Surveys, gather data on everyone living in a household but measure religious affiliation only among the household members who are in their reproductive years. We used imputation methods to estimate the religious identities of other household members and of households that didn’t include anyone of reproductive age.
In most cases, all the adults who are surveyed in a household share the same religious identity. In these cases, a matching identity was applied to other household members. In cases where multiple religions were measured among multiple adults of reproductive age, assignment was based on a hierarchy of relationship closeness (in order: spouse, parent, child, other relative). For instance, if a male head of household was not asked about his religion because he was too old to be included in the fertility survey, but he lived with his Muslim reproductive-aged wife and his religiously unaffiliated nephew, his religious affiliation was assigned as Muslim.
For households in which there were no members of reproductive age, and therefore no information about religious identity was gathered, multiple imputation was applied using the multivariate imputation by chained equations (MICE) algorithm in Stata. There was enough information about adults not of reproductive age in households with adults of reproductive age to identify age, sex, marital status, educational attainment, household size, region and urbanicity as predictors of religion and to use them in the imputation. Five iterations were executed with these predictors (independent variables) for the missing data on religion. For example, in the 2018 DHS survey of Nigeria, 11% of individuals lived in households without anyone of reproductive age, so we imputed their religious identities using the MICE approach.
How did you measure religious change from 2010 to 2020?
We measure changes in the size of seven religious categories by calculating differences between our new 2020 estimates and our revised 2010 estimates for 201 countries and territories.
As we prepared our 2020 and 2010 estimates, we sought to maximize the similarity of the data sources and measurement methods used in each country for each time point. We wanted to measure real change rather than variation that could be the result of measurement differences, such as variation resulting from surveys or censuses using a one-step question about religious identity in one year and a two-step question in the other year.40
In previous reports, including our 2012 report “The Global Religious Landscape,” we presented religious composition estimates for 2010. We revised our previous 2010 composition estimates for the current report, using updated methods and data sources that weren’t available to us previously. For example, to better measure religious change in China, we have revised our approaches to measuring religion and no longer try to adjust figures from primary sources for populations that may be undercounted. Read Chapter 15 for more details.
Why do you use projections for some 2010 and 2020 numbers?
Generally speaking, Pew Research Center uses “estimates” to describe population statistics for a year in the past and “projections” to describe demographic modeling of what a population is expected to be in the future.
However, in some cases we created projections using older data to make 2020 estimates, because reliable data for 2020 was not available for all countries. In even rarer instances, we lacked a good source for 2010, so we used demographic methods to “back project” a population in 2010 using data from a more recent year. All our projections – both backward and forward – are based on differences by religion in age structure and fertility.
For more information about methods used in projections of religious populations, read the Methodology of our 2015 report “The Future of World Religions: Population Growth Projections, 2010-2050.”
Highlighting substantial change at the country level
If a religious category’s share of a country’s population grew or shrank by at least 5 percentage points between 2010 and 2020, we consider this a substantial change. By using the same country-level threshold of at least 5 points, we describe change of comparable magnitude across contexts.
This threshold allows us to highlight notable change at the country level in the absence of statistical significance tests.
We did not conduct significance tests for a few reasons, the most important of which is the variability of the source data. For example, among countries that collected census data on religion in 2010 and 2020, relatively small changes – below 1 percentage point – would be statistically significant. On the other hand, among countries in which the best source of religious composition in each year is a survey of the adult population, statistically significant changes typically would need to be larger than 1 or 2 percentage points, since surveys have much less statistical power than censuses.
Moreover, our survey-based estimates include indirect estimates of the religious composition of children as well as estimates of small groups and migrants based on a mix of other sources. It would be difficult to perform statistical significance tests for differences between 2010 and 2020 estimates that combine direct and indirect estimation methods as well as data from multiple sources.
Why do Pew Research Center numbers sometimes vary from published census numbers?
One reason our numbers may differ from published census figures is that we exclude responses from people who do not answer a religious identity question. Some countries that measure religion in their census make clear that answering the religion question is optional. Census agencies often report results based on the overall population rather than just people who provided an answer to the religion question. For example, published religion results from the 2021 census of England and Wales show that 6% of people fell into the “not answered” category.41 We don’t know which mix of our seven religion categories best describe the people who don’t answer religion questions. By treating this missing data as invalid, we effectively assume that the people who don’t answer census religion questions have a similar mix of religious identities as those who do provide answers.
Another reason is that we use the United Nations’ World Population Prospects (WPP) estimate of residents in each country or territory, and these vary modestly from census population counts.
How did you measure demographic characteristics?
Age structure
To estimate religious composition by each five-year age and sex cohort in a population (e.g., men ages 25 to 29 and women ages 40 to 44), we begin with data on age, sex and religion from surveys and censuses. In some cases, we use a combination of multiple datasets and demographic smoothing techniques to make age structure estimates for each year (2010 and 2020). We typically use these approaches to compensate for data limitations that emerge when using a general population survey to describe many cohorts in each country.
Fertility
We present data on fertility differences by religious category to help explain trajectories of population growth from 2010 to 2020. The estimates of 2010 to 2015 fertility in this report were prepared for our earlier report “The Future of World Religions: Population Growth Projections, 2010-2050.”
Fertility data was gathered from censuses and surveys, and fertility rates were estimated via direct and indirect measures. Some censuses and surveys directly measure recent births, or the count of children a woman has ever given birth to, at the time of the survey. In other cases, fertility data was gathered indirectly, for example, by using data on the age of a mother’s children to estimate her past birth patterns. These various sources of fertility data were used to estimate age-specific and total fertility rates for religious groups in each country.42
In many countries, data on differential fertility is available for the largest religious groups but sufficient detail is not available for all minority religious groups. In Nigeria, for example, more than 98% of women of reproductive age are either Christian or Muslim, and there is sufficient data for estimating fertility for these two groups. For other religious groups in Nigeria, however, researchers had to base estimates on more limited data.
In some countries, data on differences in fertility by religion was not available. In these cases, researchers applied prevailing national fertility rates to all religious groups equally.
Migration
Estimates of the religious composition of migrants are drawn from our 2024 report “The Religious Composition of the World’s Migrants.” Those estimates were made using migrant stock estimates from the United Nations as well as data from 270 censuses and surveys. Read that report’s Methodology for more details.
Mortality (life expectancy)
Mortality patterns can be described with data on the rate of deaths experienced by various age groups in a population in a given period. To provide a snapshot of mortality patterns in a period, it is convenient to transform these period death rates into statistics about the expected longevity implied by these rates – life expectancy at birth.
Because no global data is available on how life expectancy varies by religion within countries, we estimate global life expectancy for each religious group by assuming that people in all religious groups have the average life expectancy of the country in which they live.
Therefore, global differences in life expectancy between religious groups reflect their geographic concentrations. For instance, the relatively high life expectancy of Jews reflects the fact that the vast majority of the world’s Jews live in either the United States or Israel – both of which are places where life expectancy is above the global average.
How did you measure religious ‘switching’?
In this report, religious “switching” refers to a change between the religious group in which a person says they were raised (during their childhood) and their religious identity now (in adulthood). We use the term “switching” rather than “conversion” because many people who switch identities leave a religion and become religiously unaffiliated, and also because the changes often take place without any formal declaration or ritual.
We count changes between seven large religious categories (such as from Buddhist to Christian, or from Hindu to religiously unaffiliated) but not switching within the same category (such as from Protestant to Catholic).
Rates of religious switching are calculated using responses to two questions that have been consistently included in Pew Research Center surveys (“What is your religion, if any?” and “Thinking about when you were a child, in what religion were you raised?”) and in International Social Survey Programme (ISSP) surveys (“What is your religion” and “What religion, if any, were you raised in?”).
In China, we take a slightly different approach. The 2018 Chinese General Social Survey does not include the same type of measure of childhood religion. Instead, we use responses to the question, “What was your mother’s religion when you were 14?” as a proxy. 43
In this analysis, we looked at the switching of adults under 55 as a way of focusing on switching that has happened in recent decades. Among survey respondents who have changed religion, we don’t have data on the age at which they switched. Religious changes can occur at any age, but previous studies have found that religious switching is more common among young adults than among older adults. Therefore, the religious switches reported by people ages 55 and older probably occurred longer ago, on average, than religious switches reported by people under 55.44
The surveys we analyze do not allow us to isolate the religious switching that took place exclusively between 2010 and 2020. Rather, they provide an overview of switching patterns that have shifted religious landscapes in recent decades, including over the period from 2010 to 2020.
Sources used to measure religious switching
Our switching analysis is based on data from 117 countries and territories, including 96 Pew Research Center surveys conducted between 2009 and 2024, 20 ISSP surveys conducted in 2008 or 2018, and the 2018 Chinese General Social Survey.45

For places with multiple surveys available, sources were chosen based on recency, sample size, and consistency with estimates from other surveys. For example, to estimate rates of religious switching in the United States, we use data from the 2023-24 Religious Landscape Study instead of the 2024 American Trends Panel because the former has a larger sample size, allowing us to reliably estimate switching patterns among U.S. Hindus, Muslims and Buddhists. (Read Appendix A for a list of countries and source information.)
Together, these 117 surveys provide samples in countries that encompass 92% of the global adult population (ages 18 to 54) in 2010, including almost all Hindus, 98% of religiously unaffiliated people and 93% of Christians. Coverage is also high for Muslims (82%) and Buddhists (85%). In the report, results for Jews and members of other religions are not shown.46
Aggregating switching rates to the global level
To quantify how common switching in and out is for each religion, we first computed country-level results for each religious category available in the data, with survey weights applied. Using information about respondents’ childhood religion and current religion, we calculated the rates of switching among religious groups in a country, including the percentage of people who were raised in a particular religion and the percentage of people who currently identify with this religion, as well as the percentage of people who left and entered each group. Read, for example, the accompanying table “Rates of religious switching in the United States.”

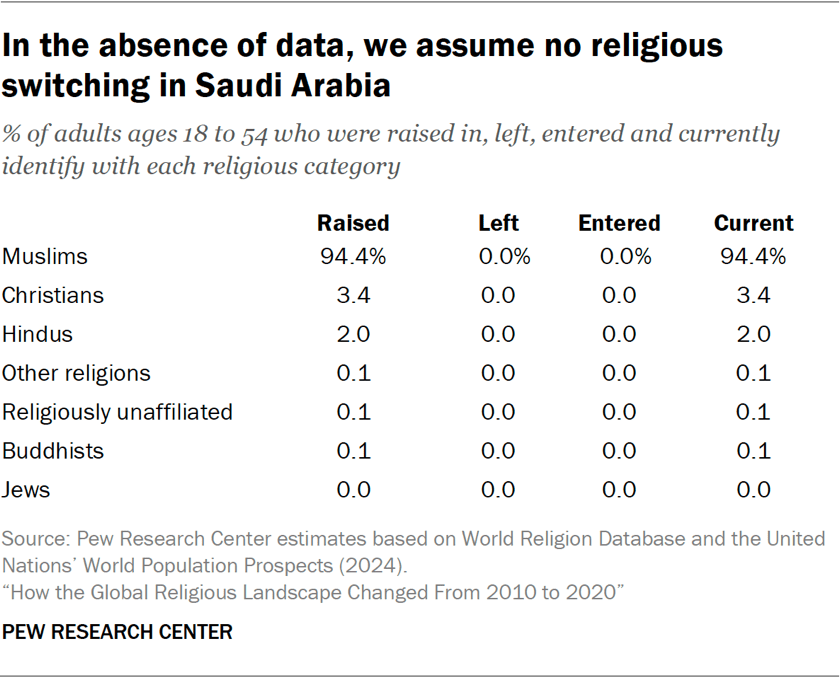
For the 84 countries where religious switching data is not available, we applied the assumption of no switching between any religious groups (i.e., by assigning the share of people who left or entered as 0% for all religions). For instance, in Saudi Arabia, where switching data is not available, we assumed no switching among religious groups. For the distribution of religious upbringing and current religious affiliation, we used our composition estimates among populations ages 18 to 54 in Saudi Arabia for the year 2010 as a proxy, as shown in the accompanying table.
To aggregate country-level results into global rates of religious switching, we weighted the data from each country proportionately to each country’s share of all people age 18 to 54 in the world as of 2010.47 The accompanying table presents the distribution of religious groups and their switching patterns in this aggregated dataset. Note that estimates do not represent the global religious composition of a particular year because the datasets analyzed were collected over a 17-year period.

Lastly, using these global percentages, we calculated the global rates of joining and leaving relative to each religion per 100 people raised in the group. This perspective allows us to compare the extent to which people move into and out of different religious groups, and how much each group has grown or declined due to religious switching. In the report Overview, we focus on the simplified ratio of people who have joined and left each group. This perspective makes it easy to compare the patterns of joining and leaving across groups.
Some readers may wonder whether large margins of sampling error for relatively small religious groups in some countries could affect our global switching results. Indeed, many of the surveys with switching data have a sample size of 1,000 to 3,000 respondents ages 18 and older, and the estimated percentages of people who were raised in, left, entered or currently are in a religion can be imprecise for small groups. This is especially true for religious groups that are heavily concentrated in a few countries, such as Hindus, Buddhists and Jews. For instance, the switching results for Hindus in European and African countries with small Hindu populations may be unreliable because fewer than 1% of adults in the sample were raised Hindu or currently identify as Hindu. However, these estimates have little impact on global patterns of switching among Hindus, because they are weighted to reflect the relative size of each country’s Hindu population when the country-level results are aggregated to the global level.
We conducted sensitivity tests to ensure the robustness of our switching estimates. This sensitivity analysis showed that because of their small sample size in most surveys, results for Jews and adherents of other religions are unstable. Therefore, we do not show global results for these two groups. (For an overview of switching into and out of Judaism in Israel and the U.S., read “Around The World, Many People Are Leaving Their Childhood Religions.”)
Global estimates for the “other religions” category vary widely depending on which countries are included in the analysis. “Other religions” is an umbrella category containing a wide variety of religions other than Buddhism, Christianity, Hinduism, Islam and Judaism. The instability of the results for this aggregate reflects the fact that religious groups constituting the “other religions” category differ from one place to another. For instance, in India, most of the adherents of other religions are Sikhs and Jains, and there is little religious switching – roughly nine-in-ten of those raised in other religions have remained in their childhood faith – according to our 2021 study on religion in India. On the other hand, in Taiwan, this category includes many Daoists, and about half of Taiwanese people who say they were raised Daoist no longer identify as Daoist, according to our 2023 study “Religion and Spirituality in East Asian Societies.”
Did any countries require special consideration?
Our research team considered the unique measurement challenges posed by the strengths and weaknesses of the data available for each of 201 countries and territories. Below we discuss some interesting cases. Although we don’t discuss every country, these examples provide a glimpse into the range of issues we considered.
China
In this report, our estimates of China’s religious composition are primarily based on the religious (zongjiao) identity measure from the 2010 and 2018 Chinese General Social Survey (CGSS).48 This is a different approach to measuring religion in China than we used in our 2012 report “The Global Religious Landscape,” and in our 2015 report “The Future of World Religions: Population Growth Projections, 2010-2050.” In the earlier studies, we relied on belief and practice measures from surveys to estimate the numbers of Buddhists and adherents of folk religions, and we used ethnicity data from the Chinese census to approximate the size of China’s Muslim population, which predominantly consists of 10 ethnic minority groups that traditionally practice Islam.
In this report, for comparability with religious composition estimates around the world, we updated our strategy for China and relied on direct estimates from the CGSS for all religious groups. Because the CGSS includes a larger share of Muslim ethnic minorities than China’s census, and the default survey weight does not correct for this imbalance, we modified the weight in the CGSS to ensure the accuracy of our estimate for Muslims. Specifically, we reweighted the CGSS sample so that the share of adults in predominantly Muslim ethnic groups aligns with their representation in the national census.
Most Muslims in China belong to the Hui and Uyghur ethnic groups. Based on data from the 2010, 2012, 2017 and 2018 waves of the CGSS, more than 9-in-10 Hui and Uyghur adults identify as Muslim. By contrast, self-reports of Muslim identity are rare (less than 0.5%) among the Han ethnic group, which makes up a majority of China’s population. Most Uyghur people live in Xinjiang, a provincial unit that the CGSS has not surveyed since 2013. We do not have any information about whether restrictive Chinese government policies in Xinjiang have reduced rates of Muslim identification among Uyghurs and other traditionally Muslim ethnic groups in the region. (For more details about the weight adjustment and our new method of measuring the number of Chinese Muslims, read the “Estimating Islam in China” section of our 2023 report, “Measuring Religion in China.”)
We acknowledge the limitations of using the religious (zongjiao) identity measure to estimate China’s religious landscape. Our research shows that this measure does not capture Chinese people who may hold religious beliefs and engage in religious practices but do not consider themselves to be affiliated with any religion in a formal sense. Meanwhile, some scholars argue that Chinese surveys that ask about religious (zongjiao) identity may undercount Christians, because some Christians – particularly those who worship in unauthorized churches – may not agree to be interviewed or may not divulge their religious identity to interviewers. Asking survey respondents whether they have a formal religion (zongjiao) also produces a conservative estimate of the number of people in China who practice elements of Buddhism, as discussed in the “How many Buddhists are there in China?” section of our 2023 report. Nevertheless, the zongjiao identity measure has several benefits. It does appear to capture respondents who feel formally affiliated with religion and are actively engaged in religious beliefs and practices. Additionally, zongjiao measures generate results that are relatively stable across surveys, which suggests they can provide reliable information about religious change over time.49
(For more about why we are not making adjustments for possible undercounts in Chinese surveys, read the “Maximizing comparability of sources and methods” section in Chapter 15.)
Egypt
Egypt measures religion in its decennial census. However, in recent decades, the Egyptian government has not published these results, including from the most recent census conducted in 2017.
The Christian share of Egypt’s total population, as measured in the country’s census, has been steadily declining since 1927, when 8.3% of Egyptians reported being Christian. Moreover, past censuses and demographic surveys consistently have indicated that Egyptian Christians tend to be older and have fewer children than the country’s Muslim majority.
Nonetheless, for many years, journalists and government leaders have reported that 10% of Egypt’s population is Christian. Officials of the Coptic Orthodox Church sometimes claim the Christian population is even larger.
We were able to access religion results from Egypt’s 2006 census via the IPUMS data archive. In 2006, about 5% of Egyptian census respondents identified as Christian. Egypt’s religion results in this report are projected from the 2006 census.
Gulf Cooperation Council countries
The six countries in the Gulf Cooperation Council (GCC) – Bahrain, Kuwait, Oman, Qatar, Saudi Arabia and the United Arab Emirates – share similar data limitations. We applied the same method to all but one GCC country to estimate their overall religious compositions. (Census data about religion was available for Bahrain.)
Census and survey data on the religious affiliation of residents in GCC countries is generally not collected, not made available to outside researchers and/or not inclusive of the large migrant populations living there. The available information on citizens of GCC countries shows that they nearly always identify as Muslim. In Bahrain’s 2020 census, which measured only whether respondents were Muslim or not, 99.7% of citizens identified as Muslim, as did 50.9% of non-citizens. Every GCC country has a Muslim majority. Their legal and social systems are influenced by Islamic law to varying degrees, but all have consistently high levels of restrictions on religion, according to Pew Research Center studies. For example, all GCC countries have a law against blasphemy, and all but one (Bahrain) also bans apostasy (giving up or changing one’s religion).
The GCC countries have thriving economies and strong demand for foreign labor, and all attract many migrants. Migrants made up about half of the region’s 2020 population.
To overcome these data challenges, we calculated the religious compositions of most GCC countries by making two assumptions: Native-born residents are all Muslim, and foreign-born residents have the religious composition we estimated in a previous report on the religious composition of migrants by origin-and-destination country pairings. We subtracted the total number of immigrants (based on the UN’s “International Migrant Stock 2020” report) from the country’s total population (based on the 2022 update to the UN’s World Population Prospects, the most current version available at the time) to disaggregate residents by nativity. We then applied religious distributions to native- and foreign-born populations separately to arrive at estimates for the countries overall.
India
We relied on census data on religion for our India estimates. Because India’s 2021 census was delayed by the COVID-19 pandemic, our 2020 estimates are based on population projections from the religious composition in the earlier 2011 census.
There are known issues with census data on religion in India. Christians in particular appear to be undercounted; some Christians who belong to Scheduled Castes may choose to identify as Hindu when completing official forms such as the census. This is due to a mandate in the Indian Constitution specifying that only Hindus, Sikhs and Buddhists can receive some types of caste-based government affirmative action benefits (known in India as “reservations”). In our 2012 report “The Global Religious Landscape” and our 2015 report “The Future of World Religions: Population Growth Projections, 2010-2050,” we accounted for this by estimating that 10% of Christians in India state their affiliations as Hindu in the census and by adjusting the population figures accordingly.
Consistent with our 2021 report “Religious Composition of India,” this report relies on unadjusted numbers, due to the uncertainty surrounding how a bias in responses might have changed over time. Simply put, there may be an undercount of Christians in any given census, but we don’t know how big it is, and we also don’t know whether it is increasing or decreasing from one census to the next. To assess change over time in the country’s religious composition, it may be better (and more transparent) just to compare the unadjusted census figures.
(For more about why we are not making adjustments for undercounts, read the “Maximizing comparability of sources and methods” section in Chapter 15.)
Iran
Iran’s national census is the source of our religious composition estimates for the country. In the census, more than 99% of residents formally identify as Muslim.
We are aware of data describing a different picture. Recent surveys conducted by The Group for Analyzing and Measuring Attitudes in Iran (GAMAAN) paint a very different Iranian religious landscape. GAMAAN assumes that legal pressures influence how Iranian respondents answer the census and that “fear of the state” could affect responses to most surveys in Iran. Therefore, the group uses anonymous, nonprobability, online surveys to measure religion in the Iranian population. In the U.S. context, nonprobability polls can produce misleading results. However, in an effort to make the Iranian results nationally representative, GAMAAN weights the results to census and workforce parameters. Across surveys conducted in 2020, 2022 and 2023, the research group finds that a considerable share of Iran’s population does not identify as Muslim.
GAMAAN’s surveys provide an intriguing perspective on Iran’s religious landscape, but they are not suitable for measuring religious change from 2010 to 2020. GAMAAN did not conduct surveys around 2010. Furthermore, GAMAAN’s findings have not yet been replicated by other research organizations. Some of the most anomalous results, such as a relatively large share of Zoroastrians, have led scholars to wonder whether “participating in surveys beyond the government’s control” gave discontented Iranians an opportunity for “performing alternative identity aspirations.”
Israel
Our estimates for Israel come from the country’s Central Bureau of Statistics (CBS), which provide religion data from the Ministry of Interior’s population register. This data includes estimates for the country’s Jewish, Muslim, Christian and Druze populations. However, it counts as Jews only those who meet halakhic (religious) legal criteria – i.e., children of Jewish mothers as well as people who have undergone formal conversions recognized by the authorities.50 Consequently, the register data may count some people as Jewish even if they do not self-identity as Jewish by religion. At the same time, some Israelis who identify religiously as Jewish are not classified as Jewish based on halakhic criteria. (For more about how we estimate the Jewish population around the world, read Chapter 8.)
In Israel, as in other countries and territories, our estimates of the total number of residents come from the United Nations’ World Population Prospects (WPP), produced by the Population Division of the UN secretariat. The UN’s population figures are usually close to those published by each country’s census bureau or statistical agency. However, Israel’s Central Bureau of Statistics counts everyone living in East Jerusalem as part of its population, while the UN counts Arabs living in East Jerusalem as part of the population of the Palestinian territories and does not include them in Israel’s population. Both the UN and the Central Bureau of Statistics (CBS) count Jews living in the West Bank and Golan Heights as part of Israel’s population.
We followed the procedure below to reconcile the discrepancy in the total population estimates from the CBS and the UN. First, we deducted the Arab population living in East Jerusalem from CBS’s religion data using religious composition estimates of East Jerusalem’s Arab population compiled by the Jerusalem Institute. Next, we recalculated the country’s religious composition after excluding the Arab population living in East Jerusalem, which resulted in a slightly higher estimate of the Jewish share of Israel’s population in 2010 and 2020 than the CBS reported. Finally, we applied this religious distribution to the UN’s total population figure. This procedure was used for both the 2010 and 2020 estimates.
Lebanon
We took a similar approach to estimating the religious makeup of the total population of Lebanon as we did for GCC countries. About 30% of the country’s residents are immigrants. Lebanon hosts more Syrian refugees than any country except Turkey, as well as the world’s third-largest population of refugees from the Palestinian territories. We relied on a Pew Research Center survey that measured the religious composition of residents but provided limited coverage of the refugee population living in the country due to security concerns in areas where many refugees live. To account for this limitation in the survey data, we separated the native- and foreign-born populations. We applied the religious composition of the survey respondents to all native-born residents, and we applied our estimate of the religious makeup of migrants in Lebanon to all foreign-born residents.
Russia
The 2011 and 2019 waves of the ISSP were our main sources of religious composition data for Russia. To refine estimates of Russia’s religious minorities, we adjusted our estimates to account for census data on the size of various ethnic groups and survey data on the shares of Muslims and other religious minorities in those ethnic groups. We also slightly adjusted the count of Russian Jews to reflect Israeli demographer Sergio DellaPergola’s estimates, which he prepared for “World Jewish Population” chapters in the American Jewish Year Book.
Sweden
In Sweden, we began by estimating the religious composition of native-born residents using ISSP survey data. To estimate the religious composition of foreign-born residents, we used a combination of national register data on country of birth and estimates about the religious identity of immigrants to Sweden from our report “The Religious Composition of the World’s Migrants.” We combined these estimates and then refined the figures for Muslims, Buddhists and Hindus using population register data about native-born descendants of immigrants who came to Sweden in recent generations. This population register analysis was conducted by Erling Häggström Gunfridsson of Umea University.
United States
The U.S. census does not ask Americans about religion, but Pew Research Center has conducted many surveys measuring the U.S. religious landscape. Demographic estimates for the size of the Christian and religiously unaffiliated populations in 2020 come from our 2022 report “Modeling the Future of Religion in America” and are based on surveys of U.S. adults who are part of the Center’s American Trends Panel (ATP). Results are then weighted to our National Public Opinion Reference Survey (NPORS) and adjusted to include children. Christians and religiously unaffiliated people combined made up 94% of the U.S. population in 2020.
Despite its large number of panelists and rigorous sampling strategy, the ATP was not our best source for estimating the population sizes of Buddhists, Hindus, Jews, Muslims and people of other religions, who together make up 6% of the U.S. population. These smaller (and sometimes hard-to-reach) populations were better represented in specialized surveys.
Most Buddhist and Hindu residents of the U.S. are Asian American, and many are immigrants. Because ATP surveys are only conducted in English and Spanish, Asian Americans on the ATP may not be representative of all Asian Americans religiously. Pew Research Center in 2023 conducted a large survey of Asian Americans in Chinese (Simplified or Traditional), English, Hindi, Korean, Tagalog and Vietnamese. The religious composition of Asian Americans in this survey differed from those in the ATP. We incorporated information from this population-focused survey, along with U.S. Census Bureau estimates of the size of the Asian American population, into our 2020 estimates of U.S. Buddhists and Hindus.
Pew Research Center has conducted multiple studies of Jewish and Muslim Americans based on surveys focused on those populations. These surveys are advantageous because they include many more American Jews and Muslims than are on the ATP (since Jews and Muslims make up only about 2% and 1% of the U.S. population, respectively) and were offered in languages familiar to large immigrant groups within these religions, including Arabic, Farsi, Russian and Urdu, as well as Spanish and English. Information from these surveys was used to estimate the size of the 2020 Jewish and Muslim populations in the U.S. We classified the remaining 1% of the population as belonging to the “other religions” category.
How do you define regions, countries and territories?
The word “country” in this report refers to all countries recognized as such by the United Nations. The word “territory” in this report does not have a technical definition. Rather, it is a general term for distinct geographical entities that the UN doesn’t recognize as countries, but for which it provides separate population estimates. Territories in this report include such entities as Hong Kong and Macao (special administrative regions of China), Greenland (an autonomous constituent country within the Kingdom of Denmark) and the Commonwealth of Puerto Rico (an unincorporated territory of the United States).
List of countries and territories in each region
This report groups 201 countries and territories into six major regions: Asia and the Pacific, Europe, Latin America and the Caribbean, the Middle East and North Africa, North America and sub-Saharan Africa.
The 50 countries and territories in the Asia-Pacific region are: Afghanistan, Armenia, Australia, Azerbaijan, Bangladesh, Bhutan, Brunei, Cambodia, China, Cyprus, Federated States of Micronesia, Fiji, French Polynesia, Guam, Hong Kong, India, Indonesia, Iran, Japan, Kazakhstan, Kiribati, Kyrgyzstan, Laos, Macao, Malaysia, Maldives, Mongolia, Myanmar (also called Burma), Nepal, New Caledonia, New Zealand, North Korea, Pakistan, Papua New Guinea, Philippines, Samoa, Singapore, Solomon Islands, South Korea, Sri Lanka, Taiwan, Tajikistan, Thailand, Timor-Leste, Tonga, Turkey, Turkmenistan, Uzbekistan, Vanuatu, and Vietnam.
The 42 countries and territories in Europe are: Albania, Austria, Belarus, Belgium, Bosnia-Herzegovina, Bulgaria, Channel Islands, Croatia, Czech Republic, Denmark, Estonia, Finland, France, Georgia, Germany, Greece, Hungary, Iceland, Ireland, Italy, Kosovo, Latvia, Lithuania, Luxembourg, Malta, Moldova, Montenegro, Netherlands, North Macedonia, Norway, Poland, Portugal, Romania, Russia, Serbia, Slovakia, Slovenia, Spain, Sweden, Switzerland, Ukraine, and United Kingdom.
The 37 countries and territories in Latin America and the Caribbean are: Argentina, Aruba, Bahamas, Barbados, Belize, Bolivia, Brazil, Chile, Colombia, Costa Rica, Cuba, Curacao, Dominican Republic, Ecuador, El Salvador, French Guiana, Grenada, Guadeloupe, Guatemala, Guyana, Haiti, Honduras, Jamaica, Martinique, Mexico, Nicaragua, Panama, Paraguay, Peru, Puerto Rico, St. Lucia, St. Vincent and the Grenadines, Suriname, Trinidad and Tobago, U.S. Virgin Islands, Uruguay, and Venezuela.
The 20 countries and territories in the Middle East and North Africa are: Algeria, Bahrain, Egypt, Iraq, Israel, Jordan, Kuwait, Lebanon, Libya, Morocco, Oman, Palestinian territories, Qatar, Saudi Arabia, Sudan, Syria, Tunisia, United Arab Emirates, Western Sahara, and Yemen.
The two countries and territories of North America are: Canada and the United States.
The 50 countries and territories of sub-Saharan Africa are: Angola, Benin, Botswana, Burkina Faso, Burundi, Cameroon, Cape Verde, Central African Republic, Chad, Comoros, Democratic Republic of the Congo, Djibouti, Equatorial Guinea, Eritrea, Eswatini, Ethiopia, Gabon, Gambia, Ghana, Guinea, Guinea-Bissau, Ivory Coast, Kenya, Lesotho, Liberia, Madagascar, Malawi, Mali, Mauritania, Mauritius, Mayotte, Mozambique, Namibia, Niger, Nigeria, Republic of the Congo, Reunion, Rwanda, São Tomé and Príncipe, Senegal, Seychelles, Sierra Leone, Somalia, South Africa, South Sudan, Tanzania, Togo, Uganda, Zambia, and Zimbabwe.


