
This report relies primarily on data from seven waves of the Chinese General Social Survey (between 2010-21) and four waves of data from the China Family Panel Studies (between 2012-18) to discuss China’s religious landscape and how it has changed in recent years. Additionally, some analysis uses the China Labor-force Dynamics Survey (between 2012-14), World Values Survey (between 2007-18) and Spiritual Life Study of Chinese Residents (2007).
This Methodology section first describes each of these surveys. Subsequently, it describes how Pew Research Center researchers used these and other sources, including government statistics, to analyze the size of religious groups in China.
Surveys
Chinese General Social Survey (CGSS)
The CGSS is a large-scale cross-sectional survey of Chinese households launched in 2003. Since 2010, it has been conducted by the National Survey Research Center at Renmin University of China. This report relies heavily on six publicly available waves undertaken in 2010, 2012, 2013, 2015, 2017 and 2018. Each wave includes about 12,000 respondents, sampled across at least 28 of mainland China’s 31 provinces, municipalities and autonomous regions, with Hainan, Tibet and Xinjiang excluded from nearly all waves. The 2018 wave included religion modules with additional religion measures. This report also presents results from the two religion questions included in the 2021 wave of about 8,000 respondents, sampled across 19 provinces, municipalities and autonomous regions during the COVID-19 pandemic. The CGSS is funded by Renmin University and, via Project 985, the Chinese government.
(Read “How the 2021 CGSS compares with surveys in previous years” for more information.)
The CGSS consistently includes questions on religious identity and participation, which makes it useful for analyzing religious affiliation trends among Chinese adults. The CGSS question asks about religious belief (zongjiao xinyang) – language that implies a formal commitment to an organized religion or value system. The CGSS is the only survey that lists “folk religion (such as worship of Mazu and Guan Gong)”as a response option. Separately, its 2018 survey asks one third of the respondents (around 4,500 adults) about beliefs and practices commonly associated with folk religions, including frequency of visits to the gravesite(s) of deceased family members. (For more details, read Appendix B.)
Compared with other surveys, the CGSS has a wider sampling coverage.99 The CGSS covers more of China’s regions than many other surveys. The 2010 wave of the CGSS had the most extensive coverage, with respondents from all 31 provincial units in mainland China. After 2013, the CGSS did not include respondents in Xinjiang, where virtually all Uyghurs reside. The Uyghur and Hui ethnic groups make up the vast majority of China’s Muslim population. Recent waves of the CGSS underrepresent Uyghurs due to the omission of Xinjiang. However, the Hui are overrepresented in the CGSS when the standard weight is used. The CGSS includes some primary sampling units that are predominantly Hui communities, such as Tongxin, a county in Ningxia that is about 85% Hui. While Hui adults are about 0.7% of the Chinese adult population, they make up 2%-3% of respondents in most CGSS waves.
All CGSS datasets used in this report have been reweighted so that the combined weighted share of ethnic minority respondents, including these Muslim majority ethnic groups, matches the aggregate adult share of these ethnic groups in China’s census. (For more details, read the section on estimating Islam in China later in this Methodology).
China Family Panel Studies (CFPS)
The CFPS is a longitudinal survey of communities, families and individuals run by Peking University’s Institute of Social Science Survey. It has included religion measures since 2012. The CFPS takes place every two years and re-interviews respondents who participated in the baseline survey. This report draws on data from four waves: 2012, 2014, 2016 and 2018. When this report was written, the 2018 CFPS was the most current dataset with religion information available to Pew Research Center.100 Each wave includes about 35,000 adults in more than 13,000 households. The CFPS is funded by Peking University and the government-supervised Natural Science Foundation of China.
Although the CFPS interviews mostly the same respondents over time, different religion measures are used across waves, which makes it challenging to measure religious change. For instance, the 2012 survey measures religious affiliation, while the 2014 survey asks about belief in (xin) gods/deities. When similar questions are asked in multiple waves, differences in wording and response categories make it hard to determine the extent to which apparent differences represent real change. Most interviews were conducted face-to-face. The share of interviews conducted over the phone made up 5% or less in the earlier waves, while about 17% of interviews in each of the 2016 and 2018 surveys were conducted by phone.101
In addition, the CFPS survey has a higher rate of missing religion variables than other surveys. For instance, religious affiliation is missing for about 10% of respondents in the 2016 CFPS survey, while nonresponse on the religion variable is typically less than 0.1% in the CGSS. The CFPS’s higher proportion of missing data is primarily the result of survey design: The survey allows family members to answer nonattitudinal questions when the respondents are not present in the household at the time of the interview.102
The CFPS includes measures of religious beliefs, practices and the importance of religion (zongjiao). The most recent wave, conducted in 2018, collected information on belief in various deities – Buddha and/or a bodhisattva, Taoist deities, Allah, Jesus Christ, Tianzhu (the word Chinese Catholics use for God) – and other supernatural concepts, such as fengshui and ghosts.
The 2016 survey asked about respondents’ engagement in specific religious activities such as burning incense or venerating Buddha/deities (shaoxiangbaifo) and attending worship services (zuo libai). The survey assumed that Buddhists and Taoists do not attend worship services and that Christians and Muslims do not burn incense to worship Buddha. Therefore, the question about burning incense was not asked of Muslim and Christian respondents, and the question about attending worship services was skipped for Buddhists and Taoists. (For more details, read Appendix B.)
China Labor-force Dynamics Survey (CLDS)
The CLDS is a survey project run by the Center for Social Science Survey at Sun Yat-sen University. The CLDS collects data on communities, households and working-age individuals (ages 15 to 64). This report uses data from the 2012 wave, which had more than 15,000 adult respondents, and the 2014 wave, which had more than 21,000 adult respondents. When the report was written, the 2014 CLDS was the most recent dataset available to Pew Research Center. The CLDS is funded by the Guangdong government and China’s central government via Project 985. The CLDS collected information on religious affiliation between 2012 and 2018, so this survey can be used to assess religious change among the adult population under age 65 during this period.
However, Pew Research Center did not receive approval to access 2016 and 2018 data due to the CLDS’s data sharing policy, which restricts access to university staff/students or independent researchers in China only.
The CLDS data also includes religious site information at the neighborhood committee level. Neighborhood committees – known as villagers’ committees (cunweihui) in rural areas and as residents’ committees (juweihui) in cities – are the smallest administrative unit in China.103 The survey covers between 300 and 400 neighborhood committees in each wave and asks an informed staff member on the committee about whether there are any Buddhist temples, Taoist temples, folk religion shrines, churches, ancestral halls, and mosques in the committee’s jurisdiction. (For more details, read Appendix B.)
World Values Survey (WVS)
The WVS is a research program headquartered in Stockholm, Sweden. It’s run by an international network of survey researchers. The most recent wave of the China survey (2018) was conducted by the Center of Survey and Public Research at Shanghai Jiao Tong University. Data in this report is from three waves. The 2007 and 2012 waves had about 2,000 respondents each. The 2018 wave had 3,036 respondents and was funded by Shanghai Jiao Tong University, Shandong University, Peking University and Tsinghua University. The 2018 survey consists of respondents from 29 provincial units (Tibet and Xinjiang are excluded).
The WVS survey, despite its relatively small sample size, provides a unique perspective on religious trends in China because it includes questions not asked in other surveys. Besides collecting information on religious affiliation and participation, the survey includes measures of the importance of religion, including the importance of teaching religious faith to children, and a measure of atheist identification. The 2012 and 2018 waves measure belief in life after death, belief in hell, and belief in heaven. (For more details, read Appendix B.)
Spiritual Life Study of Chinese Residents (SLSCR)
The SLSCR is a nationally representative survey conducted in 2007 by the Chinese polling firm Horizon Research Consultancy Group. The survey follows a multi-stage sampling design and consists of 6,861 adults interviewed in 24 provinces in China (excluding Hainan, Jilin, Ningxia, Qinghai, Tianjin, Tibet and Xinjiang).
The SLSCR includes detailed questions on religious beliefs and practices, including those relating to Chinese folk religion. The survey includes a wide range of religion measures, such as the practice of burning incense to pay respects to deities at home or in a temple, attending worship services in church, and beliefs in various supernatural beings, including Buddha, Jesus Christ, deities and ghosts.
Several measures of religious beliefs and practices in the SLSCR are similar to measures in the CFPS, but differences in question wording often make it difficult to infer trends by comparing the two surveys. For example, the SLSCR asked respondents about believing in (xiangxin) Buddhismor believing in (xin) Buddha, while the CFPS measured belief in (xin) Buddha and/or a bodhisattva. The former captures respondents who either identify with Buddhism or believe in Buddha, while the latter measures belief in Buddha and/or a bodhisattva. (For more details, read Appendix B.)
How the 2021 CGSS compares with surveys in previous years
The most recent Chinese General Social Survey (CGSS) was conducted roughly between June and September 2021, during the COVID-19 pandemic. This period encompassed the initial surge of the highly transmissible and aggressive delta variant. Under China’s “zero-COVID” policy, neighborhoods and sometimes entire cities imposed strict lockdowns – including limits on movement outside of homes and closing of public venues – when new local infections were recorded. For instance, neighborhoods in several cities of Guangdong province were in lockdown in June 2021 due to the spread of the delta variant, and by August, the variant had caused lockdowns in more than a dozen provinces in China.
Although pandemic constraints may have affected the implementation of the survey across China, it appears the CGSS team did not revise their sampling strategy, according to their description of the 2021 wave. Following the same sampling plan as in previous years, they selected 125 primary sampling units (PSU) from the national total of 2,762 county-level units, with China’s five metropolitan cities (Shanghai, Beijing, Shenzhen, Chongqing, and Tianjin) each set as a separate self-representative stratum.104
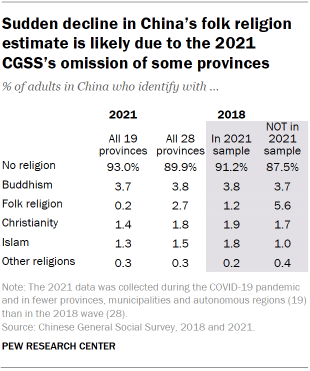
However, the CGSS team ended up collecting data in fewer provinces, municipalities and autonomous regions (19) in the 2021 wave than in previous years (28-31). In 2018, data was collected in 28 provinces. Pew Research Center emailed the CGSS team to ask for an explanation, but we did not receive a reply. The reason may be that data collection was difficult or impossible in some provinces, such as Guangdong, Shanghai and Yunnan, during the delta variant outbreaks.
Data collected in the 2021 wave covered provinces where 70% of China’s population resides – as opposed to more than 99% in previous years. Excluding those provinces does not seem to affect demographic measures including age, sex, urbanicity and education, which are corrected by the survey weight. However, the survey weight does not adjust for religious affiliation.
The 2021 estimates of religious affiliation differ from previous waves. For example, in the 2021 CGSS, 0.2% of Chinese adults identify with folk religion (responding that they venerate “Mazu, Guan Gong, etc.”), compared with 2.7% in 2018. Meanwhile, the share of Chinese who say they have no religious belief (zongjiao xinyang) was 3 percentage points higher in 2021 than in 2018 (93% vs. 90%).
A closer look at the data suggests the nine provinces that were missing from the 2021 wave compared with the 2018 wave – Guangdong, Guizhou, Heilongjiang, Jilin, Qinghai, Shanghai, Sichuan, Tianjin and Yunnan – together have a higher share of folk religion adherents than the rest (6% vs. 1%).
Due to these limitations of the 2021 CGSS, the discussion of religious affiliation in this report is primarily based on data collected from 2010 until 2018.
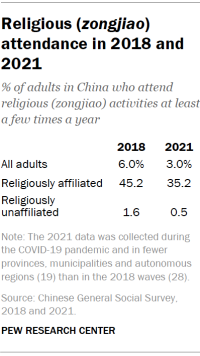
In addition, since the 2021 survey was conducted during a period of severe restrictions on travel and indoor gatherings, we did not use the latest wave to explore the trend of religious (zongjiao) participation either. The 2021 CGSS shows that about 3% of Chinese adults reported attending zongjiao activities at least a few times a year, down from 6% in 2018.105 This statistically significant decline may be a pandemic effect, though it was unclear how respondents who switched to participating in such activities remotely reported their religious attendance, as the CGSS did not specify the ways in which religious activities take place. (Read Appendix B for details on religion questions in each survey).
Government data
In this report, government statistics refer to data and estimates published by either the Chinese government, the Chinese Communist Party (CCP), or state-controlled agencies and organizations that are directly supervised by the State Council of China. This report uses government statistics to report on several measures, including counts of religious personnel and registered places of worship, tourism, crude birth rates and CCP membership. Below is a summary of government data sources used in the report.
Numbers of clergy and registered religious venues
Government statistics on religious sites and clergy came primarily from the State Council of the People’s Republic of China Information Office’s White Paper on Religion (1997 and 2018). Pew Research Center researchers also obtained some government statistics from articles published in state-run media. For example, our 2009 official figures came from a Xinhua news article.
In addition, we drew further information on clergy and worship sites from the websites of government agencies on religion, including the National Religious Affairs Administration (NRAA), formerly known as the State Administration for Religious Affairs (SARA) and five state-run agencies for religions, namely the Buddhist Association of China, the China Christian Council and the Three-Self Patriotic Movement (Protestant Christianity), the Islamic Association of China, the Catholic Patriotic Association, and the Chinese Taoist Association. For example, the number of officially registered Buddhist and Taoist temples by province came from the NRAA’s website on worship sites, while the province-level data on the distribution of mosques was from the Islamic Association of China.
Tourism
Statistics on tourism came directly from government reports. The number of domestic tourists were from the Ministry of Culture and Tourism’s annual reports. The number of visits to Jiuhua Mountain scenic area came from Anhui Bureau of Statistics’ annual reports on economic and social development of Chizhou prefecture. The number of visits to Wudang Mountain each year was sourced from news reports.
Crude birth rates
Government statistics of crude birth rates at the national level and in Xinjiang came from China Statistical Yearbook (2009-22). Those in Kashgar were from annual reports on economic and social development of Kashgar prefecture (2009-20).
CCP members and organizations
Official figures on CCP members came from annual reports published by the Organization Department of the CCP Central Committee (2008-21).
Estimating Islam in China
One approach to estimating the number of Muslims in China is to simply add up the members of each traditionally Muslim ethnic group using census data. However, this approach assumes that all members of these specific ethnic groups identify as Muslim, though survey data indicates that this is not the case. Roughly 10% of Hui or Uyghur adults do not identify as Muslims, according to the 2010 Chinese General Social Survey (CGSS). Second, this approach fails to consider Muslim converts of other ethnicities, especially among the majority Han population.
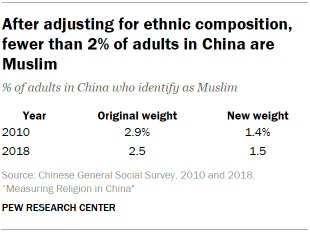
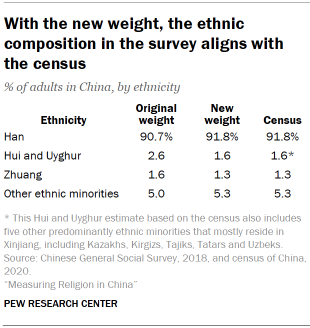
Many surveys exclude Xinjiang, a sparsely populated province where most Chinese Muslims reside.106 Furthermore, most surveys are not weighted to represent China’s ethnic composition. To address these issues, we modified the weight in the CGSS – the survey with the most extensive geographic coverage – to match the ethnic composition of China.107 We adjusted the shares of Huis and Uyghurs (who account for more than 90% of China’s predominantly Muslim ethnic population) and Zhuang adults (China’s largest ethnic minority group) to align with their shares in the Chinese census.
In addition, because the CGSS has not been conducted in Xinjiang since 2013 and Xinjiang is home to not only most Uyghurs (99%), but according to the 2020 census, is also home to five other predominantly Muslim ethnic minorities – Kazakh (99%), Tajik (99%), Kirgiz (97%), Uzbek (97%) and Tatar (92%) – we made adjustments so that in aggregate, these five ethnic groups are proportionally represented in the CGSS sample.
We used ethnic composition information from the 2010 Chinese census to reweight the CGSS waves conducted between 2010 and 2015, and the latest 2020 census was used to adjust the weight in the 2017, 2018 and 2021 CGSS.
After the weight adjustment, the ethnic composition in the CGSS is comparable with the census. For instance, in the 2018 CGSS, Uyghur and Hui adults, together with five smaller predominantly Muslim ethnic groups, account for roughly 1.6% of the adult population, which is identical to their share in the 2020 census.
This approach assumes the Muslim share among Hui people continues to be a good estimate of the Muslim share among Uyghurs and other Muslim-ethnic groups mostly living in Xinjiang.108 The 2010 CGSS found about nine-in-ten Hui adults (89%) and Uyghurs (90%) identified as Muslim. Muslims identification was higher among both groups in the 2012 CGSS (96% Hui, 99% Uyghur).
Based on this data, it seems reasonable to assume that Uyghurs and Huis identify as Muslim at similar rates, though more data is needed to gauge how Muslim identification among Huis and Uyghurs may have changed in recent years. After 2013, the CGSS did not collect data in Xinjiang. In any case, adjusting the ethnic composition improves the proportional representation of Muslims in the CGSS by properly representing the aggregate size of traditionally Muslim ethnic groups.
Exploring the underreporting of zongjiao affiliation in Chinese surveys
Scholars often argue that Chinese surveys that ask about religious belief (zongjiao xinyang) may suffer from underreporting. They argue that this issue may specifically lead to an undercount of Christians, because some Christians – particularly those who worship in unauthorized churches – may not agree to be interviewed or divulge their religious identity to interviewers.109
In recent years, the Chinese government has tightened control over religion and intensified crackdowns on unauthorized religious groups and activities. It is possible that surveys now suffer from more underreporting than in the past, as Chinese people are under more pressure to distance themselves from religion (zongjiao), especially unauthorized zongjiao activities.
However, there has been limited research examining the underreporting of religious affiliation in China using survey data, and we do not know whether the underreporting of zongjiao affiliation has become more common in recent years.
How zongjiao estimates compare between surveys with different wording
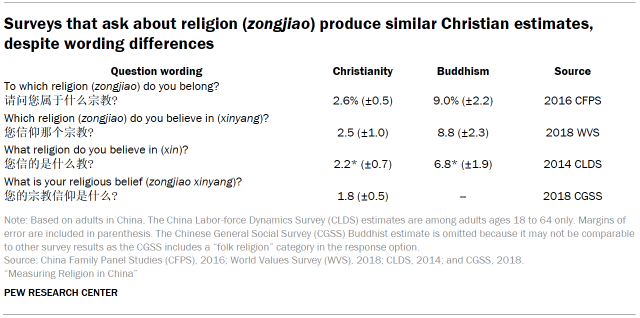
Chinese surveys that ask about religious affiliation using zongjiao as the key concept are comparable, but the question wordings and sequencing of response options are not identical. For example, the CGSS zongjiao question is worded as “What is your religious belief (zongjiao xinyang)?” and the survey consistently lists “No zongjiao xinyang” as the first response option. Meanwhile, the corresponding 2016 CFPS question is “To which zongjiao do you belong (shuyu)?” with “No zongjiao xinyang” offered as the second to last response option. (Read Appendix B for details on other survey questions).
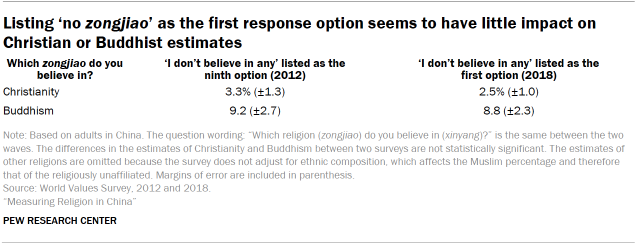
These issues may affect zongjiao estimates and contribute to differences between survey results. For example, some studies have noted the “primacy effect” – i.e., that the first category in a list tends to be over-selected by respondents. In other words, surveys with “No zongjiao xinyang” listed as the first option are likely to produce a higher share of religiously unaffiliated people than surveys that place this option last.
To explore these differences, we look closer at a variety of Christian and Buddhist estimates, by 1) comparing surveys with identical wording but different response orders, using the 2012 and 2018 WVS and 2) by comparing surveys with different wording but the same response orders.
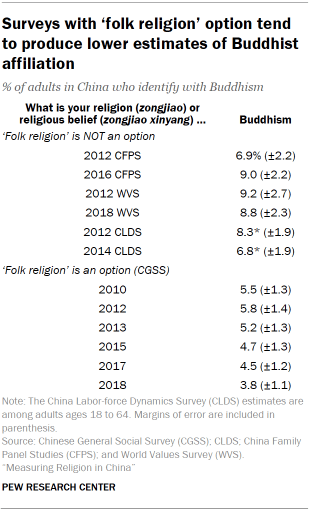
(The CGSS estimate for Buddhist affiliation is omitted from the analysis because unlike other surveys, the CGSS survey includes a “Folk religion” category in the response option. And our analysis shows that surveys with the “Folk religion” option generally produce a lower estimate of adults who identify with Buddhism than surveys without a “Folk religion” response option.)
Our analysis indicates that zongjiao measures generally produce similar results across surveys despite differences in question wording and response orders (at least, when it comes to the placement of the “No zongjiao” option.) The differences in Christian or Buddhist estimates between surveys are not statistically different.
Identifying with more than one religion
In addition, surveys that allow respondents to choose more than one response option to the zongjiao question produce statistically insignificant differences compared with those that allow only one answer. This is because most Chinese people who identify with a religion identify with only one, even though many mix beliefs and practices from multiple faiths. Fewer than 0.5% of adults chose more than one religion across all four waves of the CGSS (2012-17), which allow respondents to choose more than one answer to the question “What is your religious belief (zongjiao xinyang)?”110
The most common combination of faiths is Buddhism and folk religions (74 out of the total 46,747 respondents), followed by Buddhism and Taoism (19), and Taoism and folk religions (15), according to pooled data from four waves of the CGSS. Mixing traditional Chinese religions with non-traditional religions is rare. Fewer than 20 respondents identified with both (a) traditional Chinese religion(s) such as Buddhism, Taoism or folk religions, and (a) nontraditional religion(s) such as Catholicism, Orthodox Christianity, Protestantism or Islam at the same time.
Identifying with more than two religions is also uncommon: Only 11 respondents across four waves chose more than two religions.
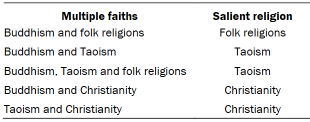
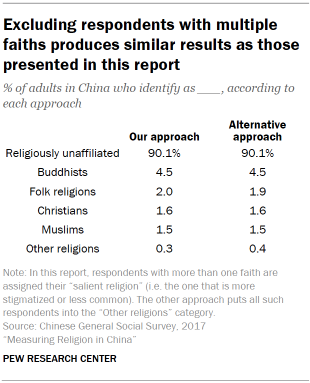
When estimating religious composition in China, we collapsed respondents with more than one religion into a single religion to avoid double-counting. We categorized respondents based on considerations of scarcity and stigmatization. When respondents identified with more than one religion, we classified them based on the identity that is more stigmatized in Chinese society and/or the less common religion.
For example, between Buddhism and Taoism, Taoism is rarer, and between Christianity and Taoism, Christianity is more stigmatized in China.
There are other plausible approaches to handling cases with multiple faiths, such as assigning anyone who identifies with more than one religion to the “Other religions” category. But because adults with multiple faiths make up only a tiny fraction of the population, any recoding strategy has little impact on the share of each religious group. Alternative recoding approaches produce similar results as those presented in this report. In the 2017 CGSS for example, Buddhists account for 4.5% of the total adult population, according to the above approach. The estimate remains the same when excluding respondents who identified with Buddhism and (an)other religion(s) at the same time. A similar pattern exists for Christianity, Islam and folk religions.
Our previous estimates of China’s religious composition
In this report, we describe the challenges of estimating the sizes of religious groups in China and explain how estimates vary depending on whether the underlying survey data measures formal zongjiao affiliation, or (non-zongjiao) beliefs and practices. We also describe cultural and political pressures that could constrain what respondents say in surveys.
This report is Pew Research Center’s most in-depth analysis of the challenges of measuring religion in China, but it is not the first time we have wrestled with this topic. For example, our 2011 report on Global Christianity included a lengthy Appendix about the difficulty of measuring Christianity in China. In the Methodology for our 2012 report, “The Global Religious Landscape,” we explained how we used a unique mix of methods to address challenges of estimating the size of China’s religious groups.
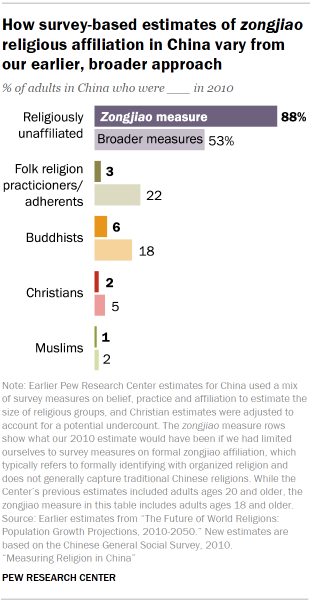
The 2011 and 2012 reports relied on the 2007 Spiritual Life Study of Chinese Residents (SLSCR), which included many religion questions.111 The SLSCR has not been repeated and many of its survey questions have not been asked by other survey organizations. Nonetheless, even when we wrote our earlier reports, it was clear that according to zongjiao measures of formal affiliation, nearly nine-in-ten Chinese could be classified as religiously unaffiliated.
In 2011 and 2012, we took non-zongjiao measures into account when making estimates, which means our estimates were larger than zongjiao measures alone would indicate. For example, our estimate of the size of the Buddhist population was informed by a measure of believing in (xin) Buddha, a more inclusive measure than zongjiao identity.
The 2007 SLSCR survey did not offer a zongjiao measure of folk religions, so we classified people in the folk religion category by considering their beliefs and practices.112 We also adjusted our estimate of the Christian population in light of evidence of underreporting among Chinese Christians.113
Can Chinese survey data be trusted?
The Chinese government monitors and restricts many aspects of life, including which websites are available to Chinese residents, as well as what kinds of content can be discussed on popular messaging and blogging sites, such as WeChat and Weibo. Authorities also regulate academic research and social surveys in China.
As a result, readers may wonder how much trust to place in surveys conducted by Chinese academic organizations, such as the Chinese General Social Survey (CGSS), the China Family Panel Studies (CFPS) and the China Labor-force Dynamics Survey (CLDS).
On the one hand, these surveys are conducted by researchers at state-supervised, publicly funded universities, and the surveys themselves are often indirectly financed by the Chinese government.114 Scholars at Chinese universities may need the government’s tacit or explicit approval to continue their research and advance in their careers. Also, when survey interviewers introduce themselves to respondents, they may present letters of recommendation from local authorities to help demonstrate their legitimacy. Interviewers sometimes seek additional help from local officials to gain cooperation from interviewees, and in some cases an official may even be present during the interview, although this appears to be rare. For example, a local official was recorded as being present during 0.4% of interviews for the 2018 CFPS.115
On the other hand, the scholars at Renmin University, Peking University and Sun Yat-sen University who conduct the CGSS, CFPS and CLDS are highly credentialed experts in their fields. Each of these survey teams has an international advisory committee that includes experts in survey methodology. For example, the CFPS team collaborated with researchers from the University of Michigan’s Survey Research Center to design and carry out their survey project. Finally, the consistency of survey results over many years, and the comparability of results across survey projects, suggests that the findings do not fluctuate substantially in response to changing government regulations of religion. And, in addition to the government-supported academic surveys analyzed in this report, data collected by Horizon Research Consultancy Group, a private organization that conducts surveys in China, shows broadly similar patterns in measures of religion.
This report discusses both the strengths and the limitations of information on religion from China. Pew Research Center’s demographers have identified and clearly called out some data points that should be viewed with caution, such as official statistics on numbers of worship sites.
Overall, however, the survey findings discussed in this report can be considered the best available source of national-level information in a country where Pew Research Center and other independent, international researchers are not currently able to freely conduct their own surveys. While it is possible that Chinese respondents do not reveal the full extent of their religious affiliations, beliefs and practices to interviewers, multiple surveys conducted by different organizations over the past two decades consistently show Chinese respondents telling interviewers they have low levels of identification with organized religion (zongjiao), yet they affirm specific beliefs and practices that may be considered spiritual or religious.
Aside from surveys, there are limited methods for measuring China’s religious landscape. Qualitative studies of communities provide rich, nuanced information about religious life in those settings. However, it is impossible to know the extent to which studies in one geographic area of China are representative of other areas. The government collects some statistics through official government religious associations, but the methodology and reliability of these statistics is not clear. Some religious groups collect their own statistics, but no organization collects membership statistics on Buddhists, Taoists or people who observe folk religions. In other words, while it is important to keep in mind the limitations of surveys, they are the best tool available – and in some respects the only tool – for measuring national trends in religion in China.
The COVID-19 pandemic created additional hurdles for survey research. For example, as discussed earlier, the 2021 Chinese General Social Survey was conducted in only 19 of mainland China’s 31 provinces, autonomous regions and municipalities. China enforced strict “zero-COVID” lockdowns during the pandemic, and when the survey was fielded from roughly June to September 2021, the delta variant of the coronavirus made face-to-face surveys difficult in regions where it would otherwise have been conducted.


