
This study projects the future population sizes of Christians, religious “nones” and people of other religions in the United States. Since recent religious change in the U.S. has been driven primarily by voluntary changes in religious identity – religious switching – we modeled for the first time how the religious landscape could change in scenarios with different patterns of future switching, as well as additional scenarios quantifying the relative impact of other dynamics, including migration, fertility and transmission of religion from parent to child. Methodologically, the study builds on the multistate cohort component methods used in previous Pew Research Center studies projecting the future of world religions, as well as how migration may shape Europe’s growing Muslim population.
Previous religious population projections by Pew Research Center assumed that all children inherit their mother’s religion (or lack of religion). We were aware that this is an oversimplification of the process of intergenerational religious transmission, but in most countries, we did not have input data on which to model more nuanced transmission dynamics. We do not know of any prior population projections that have attempted to model anything aside from perfect transmission of religious identity from parent to child. This study uses Pew Research Center data about levels of religious transmission between parents and their children to model the potential breakdown of intergenerational religious transmission.
While religious switching is typically concentrated among young adults, Center researchers have found that in recent decades, there also has been a modest amount of switching among adults over age 30. In a theoretical innovation, this study posits that later adult switching may be a part of the process whereby societies in which 90% or more of adults once identified as Christian transition to a society with significantly lower Christian retention rates. In a methodological innovation, we model this phenomenon of later adult switching continuing for cohorts that still had levels of Christian identification over 70% at age 30.
This Methodology section provides details on the input data and methods used in the projections. The first section explains how the baseline (2020) religious composition estimates were derived. The second section describes how key input data (age and sex composition, fertility, mortality, migration, transmission and religious switching) were gathered. The third part of this Methodology details the projection methods. Appendix A describes the survey sources used in this report. And Appendix B presents U.S. religion trends from a range of surveys and discusses analysis of international retention rates that influenced projection assumptions in this report.
Input data
This is an overview of input data used for the baseline population and projections in this report. In the projections, results for men and women are modeled separately because men and women vary in religious composition, switching rates, rates of inheriting their mother’s religion (intergenerational transmission) and life expectancy. In the report, these results are aggregated to report on men and women together. We do not have enough data on people who say their gender is different from their sex assigned at birth to separately project religion trajectories for people who are transgender or nonbinary.
Baseline structure
The baseline religious composition of the U.S. by age and sex is based on data from the American Trends Panel (ATP) and Pew Research Center’s survey of teens (for the age group including 15- to 19-year-olds). The religious composition of children ages 0 to 14 is estimated based on the age structure of women in each broad religious category, fertility patterns by religion, and the assumption that children generally inherit their mother’s religion. (In this step, we assume rates of religious inheritance similar to those used in our projection modeling, as described later in this Methodology.)
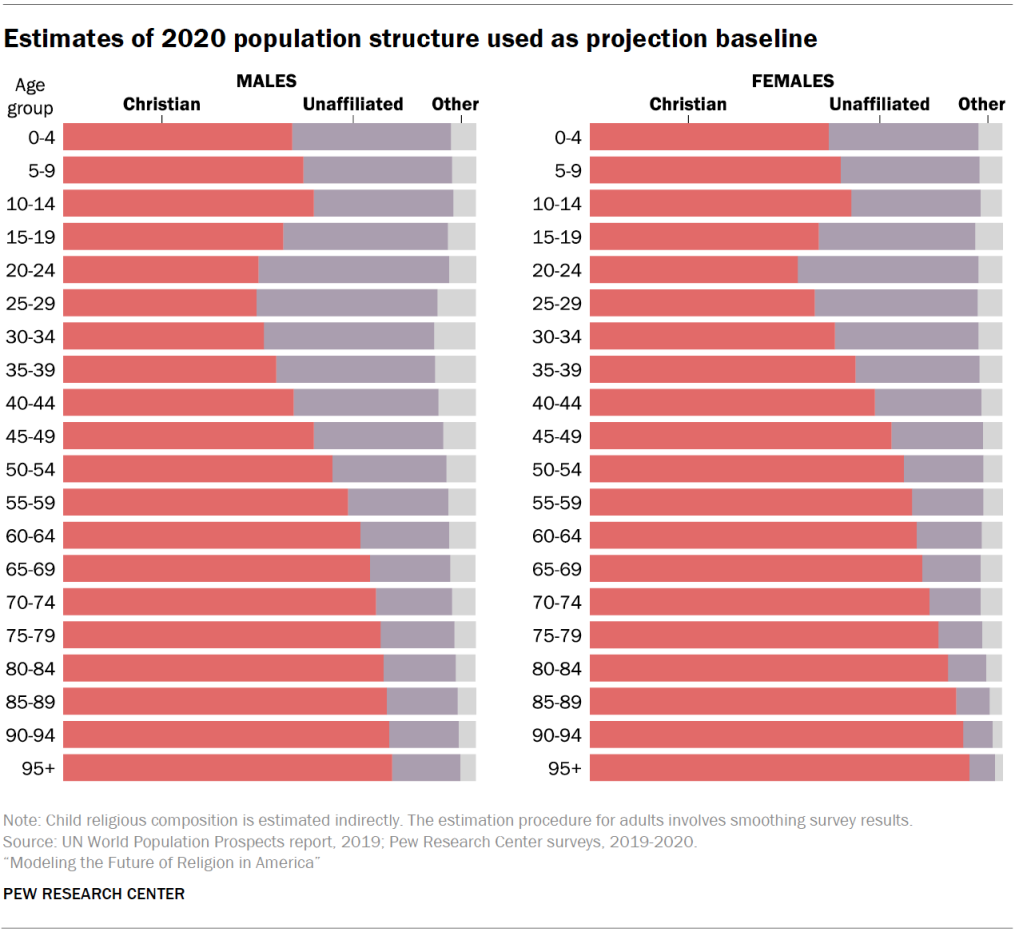
Religious composition is estimated for each five-year age and sex group, such as women ages 25 to 29 and men ages 60 to 64. For age groups older than 80, we have a modest number of respondents. The religious composition of these older age groups was estimated indirectly using a decomposition procedure, which involved extrapolating trends observed in younger cohorts to older age groups.
The religious compositions of each adult five-year age and sex group were smoothed and raked to match the overall religious composition from the ATP. This procedure minimizes jumps between age groups that may be due to statistical noise.18 To estimate the count of people in each religious group, we multiply estimates of the share of Christians, “nones” and those who identify with other religions in each age and sex group by the estimated count of total people in each cohort, according to the UN’s 2019 World Population Prospects statistics. The smoothed 2020 age, sex and religious composition is shown in the above table. This age and sex composition is the baseline for each projection scenario. (Refer to Appendix B for more information about sources of religion data.)
Fertility
Population projections use estimates of current and future fertility rates among women of different ages. In this and other Pew Research Center projections of religious change, country-level estimates of current and future fertility come from the United Nations (UN total fertility rate projections under their medium fertility scenario). According to this UN data, updated in 2019, the overall total fertility rate in the U.S. is expected to increase very slightly, but throughout this century, the UN’s expected fertility rate rounds to 1.8 children per woman.19
Data on religious differentials in fertility are based on several waves of the National Survey of Family Growth (NSFG). Estimates of fertility used in this report for Christians, religious “nones” and other religious groups are the product of differentials observed in the NSFG applied to current and future overall U.S. fertility rates estimated by the UN. Total fertility rates used for the 2020-2025 period are 1.9 for Christian women, 1.6 for the religiously unaffiliated and 2.0 for women of other religions, and these differentials remain stable throughout the projection period.
Vital Statistics data from the U.S. reveals a recent decline in fertility that is not reflected in the input data from the NSFG and the UN. According to the CDC, the fertility rate has already fallen to 1.7 children per woman. However, Vital Statistics data provides no information on religious differences in fertility and it reports only on past fertility patterns.
In Pew Research Center’s 2015 projections of religion around the world, the central projection scenario assumed that over the course of a century, fertility differences among religious groups would diminish and eventually disappear. However, past patterns suggest that the extent to which fertility rates converge may vary significantly by context. If we assume that the fertility rates of Christians, “nones” and other religious groups in the United States will converge with one another, this would lead to an uptick in the fertility of the unaffiliated, who currently have the lowest fertility rates. But we do not have clear precedent for an uptick in fertility among the unaffiliated, and since we lack clear reasons to think that fertility rates will converge among groups in the U.S., fertility differentials are assumed to remain constant in all scenarios.
Mortality
Survival rates are calculated based on mortality data from the UN’s 2019 World Population Prospects report. Mortality rates vary over time, by sex and five-year age group, but the same rates are applied regardless of religious affiliation. The UN projects that life expectancy at birth in the U.S. will increase from 79 in 2020 to 86 in 2070. The life expectancies of most other age groups are expected to increase significantly during this period as well. For example, today’s 40-year-olds can expect to live another 41 years, and people who turn 40 in 2070 are expected to have another 47 years of life, on average.
Migration
The estimated size of future migrant flows into and out of the United States are based on global migration flow estimates produced by Shanghai University professor Guy Abel, based on the UN’s 2015 estimates of migrant stocks by origin and destination. The religious composition of migrants from other countries to the U.S. is based on Pew Research Center analysis conducted for the 2012 report, “Faith on the Move – The Religious Affiliation of International Migrants,” which drew on U.S. sources including the New Immigrants Survey and the Center’s “Religious Landscape Study.” Data collected for the “Faith on the Move” report included the religious composition of U.S.-born people living in other countries. This aggregated information on the religious composition of emigrants from the U.S. is used to estimate the religious composition of people who will move away from the U.S. in future decades.20
Migration both into and out of the United States is assumed to stay constant at 2010-2015 levels throughout the projection period. Based on these estimates, migration will account for net population growth of about 5 million people in each five-year period.
Transmission
New analyses across several datasets revealed that transmission of religious identity from mothers to children falls short of the 100% transmission rate assumed in previous projection models. Transmission of mothers’ religious identity is less common when parents do not share a religion or when neither parent is highly religiously committed. The data on current transmission rates in the U.S. come from Pew Research Center’s 2019 survey of teens. In this dataset, there are many teens, often with loosely affiliated parents or with one Christian and one unaffiliated parent, who do not share their mother’s religious affiliation. This mirrors transmission patterns observed in retrospective data from older cohorts in the General Social Survey (GSS) and the National Study of Youth and Religion (NSYR). Projection scenarios compare the impact of full transmission (100% of children inherit their mother’s affiliation) to observed transmission rates from the teens survey.
It would be ideal to have measures of religious socialization and transmission in preteen years to clearly distinguish between the phenomenon of parental transmission of religion and religious switching that typically begins in adolescence and continues in young adulthood. However, the teens survey was the best source available to us about transmission that has (or has not) occurred by age 13. In the teens survey, teens ranged from ages 13 to 17. We were concerned that the religious composition of older teens might have been influenced by the religious switching that often occurs in adolescence and young adulthood. However, we found that older and younger teens in this sample were about equally likely to share their mother’s religion. Therefore, we used data from all teens in the survey to estimate transmission rates. In reality, religious transmission is a complex process that may involve a mix of intentional and unintentional actions and messages communicated by parents and others to children over the course of many years. In our model, patterns of whether teens had adopted their mother’s religion in the teens survey are used as input data to model rates of transmission as something that does or does not occur at birth. Modeling transmission or non-transmission at birth is, of course, a simplification for projection purposes.
Due to the large size of Christian and unaffiliated populations in the U.S., we have data from many more Christian and religiously unaffiliated mothers than mothers in the “other religion” category. We model the imperfect transmission of religious identity from mothers in the other religion category to their children based on data from an effective sample size of fewer than 100 respondents. Since we therefore have less confidence in other religion transmission numbers than the transmission patterns for Christian and unaffiliated mothers, transmission data for mothers affiliated with other religions is not displayed in this report. Furthermore, transmission in the other religion category may be difficult to interpret because it combines all religious identities aside from Christian and religiously unaffiliated identities.
Switching
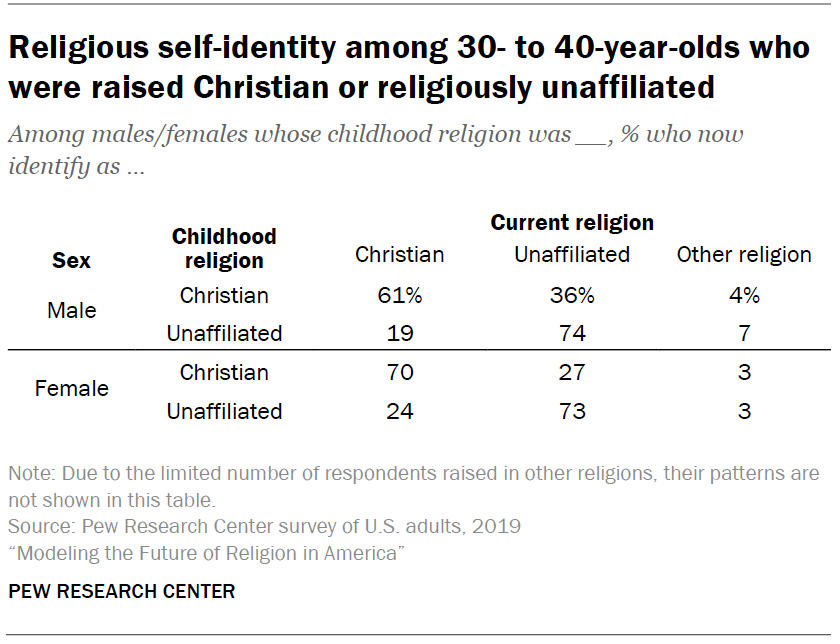
The scenarios in this report assume one of five future switching patterns: no switching at all, steady switching, rising switching rates with limits, rising switching rates without limits, and no switching after age 30. The pattern in which religious switching continues to occur among young adults (ages 15 to 29) at constant, recently observed rates is based on the amount of switching measured among people ages 30 to 40 in the ATP. These panelists are the cohort to have moved through young adulthood most recently, and also are a large enough group to base estimates on. Within this group, Christianity has retained the smallest shares of its members, with 61% of men and 70% of women who say they were raised Christian still identifying as Christian in their 30s. For the projections, probabilities of switching are distributed equally across the young adult switching period. For example, the 30% of women who would be expected to leave Christianity during early adulthood are modeled as equally likely to leave in the 15 to 19, 20 to 24, and 25 to 29 age groups.
Two scenarios account for trends in switching across cohorts and extrapolate them into the future, with or without caps on how high or low switching and retention rates could go. This is because disaffiliating from Christianity has become steadily more common across successive cohorts, and this trend could continue. Switching inputs for cohort models are based on observations in the GSS since 1973.21 Rates at ages 30 to 34 (right after the young adult switching period closes) for five-year birth cohorts are estimated using rolling averages across three observations. Depending on the scenario, this trend is either allowed to continue in a linear model or to flatten out once Christian retention reaches a low of 53% by 2050 and unaffiliated retention reaches a high of 95% by the year 2100. These shares were chosen as plausible boundaries based on the range of retention rates observed in cross-national analyses of 79 other countries from Pew Research Center, the International Social Survey Program (ISSP) and the British Social Attitudes Survey (BSAS). (The most recent data was analyzed when more than one dataset per country was available.) A lower bound for Christian retention within each generation is consistent with the supposition that the Christians remaining after a period of widespread disaffiliation will be relatively committed, rather than increasingly likely to defect.
In all of the scenarios, steady rates of switching are assumed for members of other religions due to the limited number of respondents available to provide data on patterns of retention and switching among those who grew up in other religions.
Switching after age 30
Most religious switching happens in early adulthood, but older American adults also have been disaffiliating from Christianity in recent decades. We think that disaffiliation after age 30 may be largely due to a period effect in the U.S., in which loosely affiliated people of all ages are leaving the faith now that a Christian identity is no longer so common that it is taken for granted and perceived as socially necessary. An analysis by birth cohort in the GSS revealed that, starting in the 1990s, Christian retention rates declined by about 7 percentage points after the young adult switching period in several 10-year birth cohorts.
There is not much cross-national survey data that could show what tends to happen when countries go through a period like this. The highest-quality data comes from the British Social Attitudes Survey, and Britain transitioned away from an 85-90% Christian majority much earlier than the U.S. The BSAS has been conducted every year since 1983 with a similar sample size to the GSS. (The BSAS includes a two-step question on religious affiliation, unlike the GSS.) Based on the same method as the GSS analysis, there was little further attrition from Christianity after age 30 in any Great Britain cohort going back to those born in the 1930s. The highest Christian retention rate for any cohort was about 80%.
In 20 ISSP countries where religious switching could be measured across multiple years and (relatively large) age groups, there were only two examples of further disaffiliation from Christianity among adults older than 30 once retention was already at 70% or below: France and Australia.
For scenarios that allow for more switching after age 30, an additional 7-point drop in retention – based on the pattern in the GSS over the past couple of decades – is applied to cohorts that leave young adulthood with Christian retention rates higher than 70%. This later attrition is applied evenly across ages 30 to 65. About three-quarters of American adults who were born in the 1980s and were raised Christian were still Christian in their 30s, so this will be the last birth cohort to receive an adjustment allowing for further adult attrition. People born in the 1990s and raised Christian are entering their 30s with a lower retention rate than the prior cohort, continuing the recent trends (refer to Appendix B for details on trends that inform these modeling assumptions).
Since the analysis for this report was completed, new data from Australia suggests that, at least in Australia, switching out of Christianity may continue beyond age 30, even among cohorts already at 70% or lower retention by age 30.
A July 2022 Australian Bureau of Statistics report comparing responses to Australia’s religion census question in 2016 and 2021 finds a considerable overall change in this short period. The report says that in 2016, 52% of the population identified as Christian, 30% identified with no religion, 8% identified as “other religion” and 9% didn’t answer the religion question.22 In 2021, the Christian share of respondents dropped to 44%, the religiously unaffiliated rose to 39%, 10% identified as “other religion” and 7% didn’t answer the question.
The Australia census doesn’t measure childhood religion (measuring childhood religion in any census is uncommon but Scotland included such a measure in 2001), so it isn’t possible to calculate retention rates directly from one year’s census data. But it is possible to consider how counts for groups of Australians vary from one census to the next. Because census data is gathered from the entire Australian population and since there has been considerable change in this period, it is possible to detect that among adults ages 30 and older, at each 2016 age, fewer Christians were counted in 2021. For example, 170,425 50-year-olds identified as Christian in 2016. Five years later, when this cohort was 55, they numbered only 157,097. Conversely, counts of unaffiliated older adults rose. There were 79,468 50-year-olds who identified with no religion in 2016 and five years later, their number swelled to 100,919.
In the Australia data, as in many previous studies, religious change is once again concentrated in young adult years. However, this new data reveals that in this country, where only about half of the population identified as Christian in 2016 and Christian retention among 30- to 49-year-olds had already dropped to 55% in 2018, modest levels of switching from Christianity to no religion seem to have continued among middle-aged and older adults.23
By contrast, as described previously, most scenarios in this Pew Research Center report assume that older adult switching will cease for Americans born in the 1990s and later. If these rising cohorts in the U.S. instead follow this newly observed Australian pattern of ongoing switching throughout the life course, then this report’s assumption about the end of older adult switching will have been premature.
Modeling of switching
Projections of switching used in the scenarios are based on data from the 1973-2018 GSS and the 2019 ATP. Using these sources, we estimated retention for subsequent cohorts averaging results at ages 30 to 34 at each time t; 35 to 39 at time t+5; and 40 to 44 at time t+10,assuming that most switching events occur before age of 30. Thus, averaged results from ages 30 to 44 for cohorts give us good approximation of retention. In the next step, we fit the mathematical model to these estimates. We chose the four-parameter Weibull model, which enables us to put the limits on retention levels used in some chosen scenarios. Then, the models for each religious group are used for projections of retention achieved in subsequent cohorts in the future. The retention numbers are transformed into switching rates equally distributed among five-year age groups of the main switching period of life of individuals (ages 15 to 29).
The projection approach
The technical calculations for the projections in this report were made in collaboration with the Center for Advanced Studies of Population and Religion (CASPAR) and its director, Marcin Stonawski, using an advanced variation of the standard demographic method of making population projections. The standard approach is called the cohort-component method, and it takes the age and sex structure of a population into account when projecting the population forward in time. This has the advantage of recognizing that an initial baseline population can be relatively “young,” with a high proportion of people in younger age groups (such as the unaffiliated) or relatively “old,” with a high proportion of older people (such as Christians).
Cohorts are groups of people that had an experience in a particular time. A birth cohort, the type of cohort referenced in this context, comprises people born during a certain period. Birth cohorts can also be described as males or females who have reached a certain age in a particular year. For example, the cohorts of females ages 15 to 19 in the year 2000 and males ages 15 to 19 in the year 2000 shared the experience of being born between 1981 and 1985.
Components are the three ways in which populations grow or shrink: new entrants via births, exits via deaths and net changes from migration. Each cohort of the population is projected into the future by adding likely gains – births and people moving into the country (immigrants) – and subtracting likely losses – deaths and people moving out (emigrants) – year by year. The very youngest cohorts, those ages 0 to 4, are created by applying age-specific fertility rates to each female cohort in the childbearing years (ages 15 to 49).24
The cohort-component method has been in existence for more than a century. First suggested by the English economist Edwin Cannan in 1895, then further improved by demographers in the 1930s and ’40s, it has been widely adopted since World War II. It is used by the United Nations Population Division, the U.S. Census Bureau, other national statistical offices, and numerous academic and research institutions.
The advanced variant of this approach, multistate cohort component projection, became viable starting in the 1970s thanks to the availability of mainframe computers and work by the American geographer Andrei Rogers, among others. The multistate approach permits simultaneous projection of the religious groups included in this study, taking into account variation by religion in age, sex, childbearing patterns, and propensity and direction of migration. This approach also enables modeling of religious switching as a transition between religious “states.”


