This report relies on religion data from several sources. Data on current patterns of religious switching come from Pew Research Center’s American Trends Panel (ATP). Adult religious composition data in the ATP is weighted to results from Pew Research Center’s National Public Opinion Reference Survey (NPORS). Data on patterns of religious transmission between parents and children come from analysis of a 2019 Pew Research Center survey of teens and their parents. Religious switching trend data come from NORC’s General Social Survey. Each of these sources is described below.
The American Trends Panel

The American Trends Panel, created by Pew Research Center, is a nationally representative panel of randomly selected U.S. adults. Panelists participate via self-administered web surveys. Panelists who do not have internet access at home are provided with a tablet and wireless internet connection. Interviews are conducted in both English and Spanish. The panel is being managed by Ipsos.
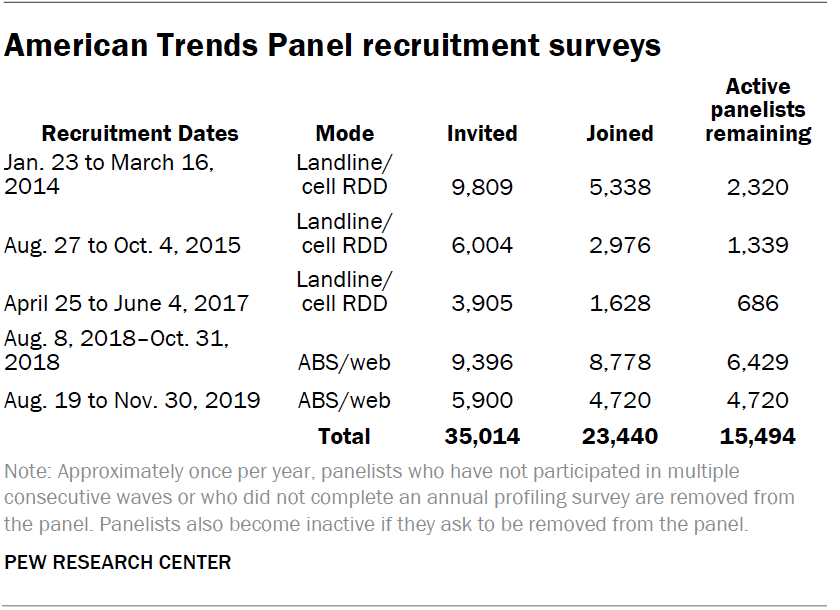
The analysis in this report is based on demographic profile data for all 15,494 active panel members as of Nov. 30, 2019. For 10,744 panelists who joined the panel prior to 2019, the data was collected on the ATP’s 2019 annual profile survey conducted Aug. 7 to Sept. 29, 2019. For 4,720 panelists who were recruited in 2019, the data was collected on the 2019 recruitment survey conducted Aug. 16 to Nov. 30, 2019.
The ATP was created in 2014, with the first cohort of panelists invited to join the panel at the end of a large, national, landline and cellphone random-digit-dial survey that was conducted in both English and Spanish. Two additional recruitments were conducted using the same method in 2015 and 2017, respectively. Across these three surveys, a total of 19,718 adults were invited to join the ATP, of which 9,942 agreed to participate.
In August 2018, the ATP switched from telephone to address-based recruitment. Invitations were sent to a random, address-based sample (ABS) of households selected from the U.S. Postal Service’s Delivery Sequence File. In each household, the adult with the next birthday was asked to go online to complete a survey, at the end of which they were invited to join the panel. For a random half-sample of invitations, households without internet access were instructed to return a postcard. These households were contacted by telephone and sent a tablet if they agreed to participate. A total of 9,396 were invited to join the panel, and 8,778 agreed to join the panel and completed an initial profile survey. The same recruitment procedure was carried out in August 2019, from which a total of 5,900 were invited to join the panel and 4,720 agreed to join the panel and completed an initial profile survey.

The U.S. Postal Service’s Delivery Sequence File has been estimated to cover as much as 98% of the population, although some studies suggest that the coverage could be in the low 90% range.25
Weighting
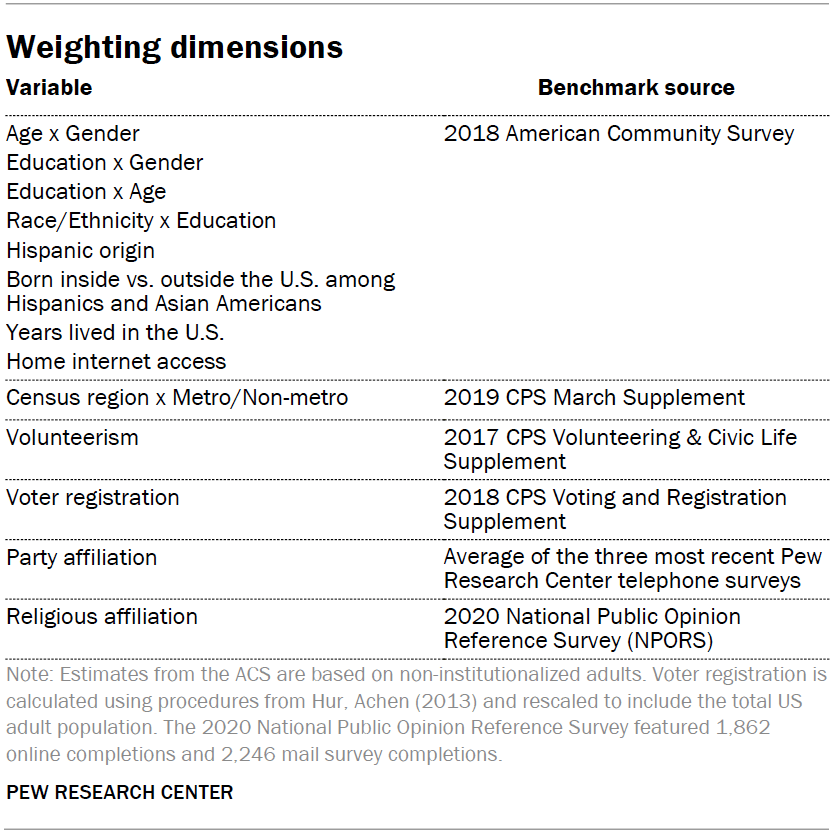
The ATP data was weighted in a multistep process that accounts for multiple stages of sampling and nonresponse that occur at different points in the survey process. First, each panelist begins with a base weight that reflects their probability of selection for their initial recruitment survey. The base weights for panelists recruited in different years are scaled to be proportionate to the effective sample size for all active panelists in their cohort. To correct for nonresponse to the initial recruitment surveys and gradual panel attrition, the base weights for all active panelists are calibrated to align with the population benchmarks identified in the accompanying table to create a full-panel weight.
In addition to sampling error, one should bear in mind that question wording and practical difficulties in conducting surveys can introduce error or bias into the findings of opinion polls.
National Public Opinion Reference Survey
The ATP may underrepresent a portion of the population that would participate by paper and pencil (if given the option) but would be reluctant to be surveyed online, and which is presumably more highly religious than the rest of the U.S. public. As a result, Pew Research Center has decided, for the foreseeable future, to adjust (or “weight”) ATP samples to religious affiliation parameters derived from the NPORS. For more explanation, please refer to the report “Measuring Religion in Pew Research Center’s American Trends Panel.” For details on the design and administration of NPORS, see the survey methodology.
Survey of teens and parents
The analysis of how religious identity is transmitted between parents and children in this report is based on a self-administered web survey conducted by Pew Research Center in 2019, among a sample of 1,811 pairs comprised of one U.S. adolescent ages 13 to 17 and one parent per adolescent. The survey was conducted by Ipsos Public Affairs in English and Spanish using KnowledgePanel, its nationally representative online research panel. Here is the survey methodology.
The General Social Survey
The General Social Survey (GSS), conducted by NORC at the University of Chicago, began in 1972 and primarily collected survey data in face-to-face interviews for most of its history. When the pandemic made face-to-face data collection infeasible, in 2021 the GSS switched to use address-based sampling for recruiting participants, who were invited to take the GSS online. This change in mode could explain some change in religious affiliation between 2018 and 2021. Complete GSS documentation and data is available at https://gss.norc.org/.


