
Only a few decades ago, a Christian identity was so common among Americans that it could almost be taken for granted. As recently as the early 1990s, about 90% of U.S. adults identified as Christians. But today, about two-thirds of adults are Christians.6 The change in America’s religious composition is largely the result of large numbers of adults switching out of the religion in which they were raised to become religiously unaffiliated.
In other words, a steadily shrinking share of young adults who were raised Christian (in childhood) have retained their religious identity in adulthood over the past 30 years. At the same time, having no religious affiliation has become “stickier”: A declining percentage of people raised without a religion have converted or taken on a religion later in life.
While religious switching is the focus of this report, other demographic forces that can cause religious change – transmission, migration, fertility and mortality – will be briefly discussed in the second half of this chapter.
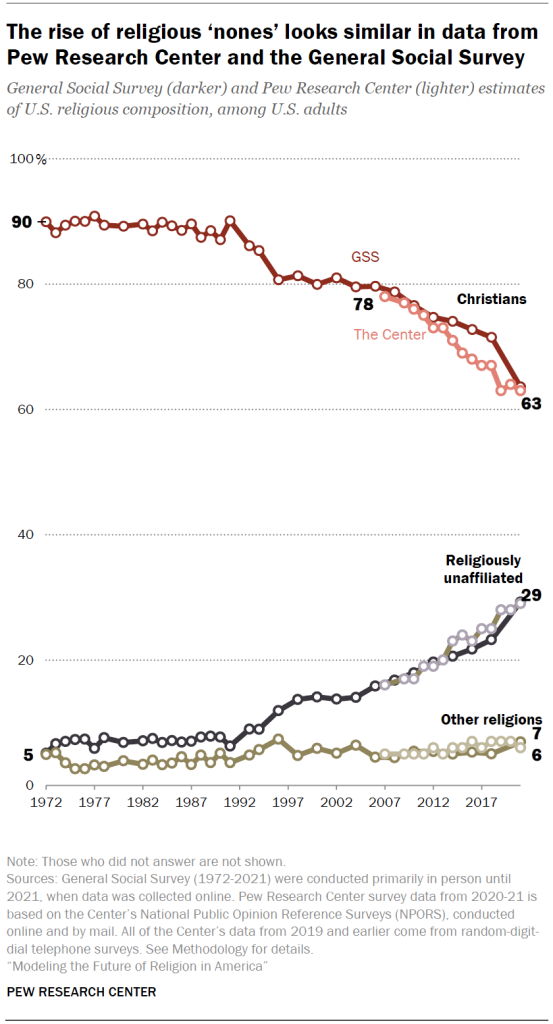
Switching gained significant momentum in the 1990s, according to the General Social Survey (GSS) – a large, nationally representative survey that has consistent data on religious affiliation going back several decades. In 1972, when the GSS first began asking Americans, “What is your religious preference?” 90% identified as Christian and 5% were religiously unaffiliated. In the next two decades, the share of “nones” crept up slowly, reaching 9% in 1993. But then disaffiliation started speeding up – in 1996, the share of unaffiliated Americans jumped to 12%, and two years later it was 14%. This growth has continued, and 29% of Americans now tell the GSS they have “no religion.”7
Pew Research Center has been measuring religious identity since 2007 using a slightly different question wording – “What is your present religion, if any?” – as well as a different set of response options. Since 2007, the percentage of adults who say they are atheist, agnostic or “nothing in particular” in the Center’s surveys has grown from 16% to 29%. During this time, the share of U.S. adults who identify as Christian has fallen from 78% to 63%.
There are many theories on why disaffiliation sped up so much in the 1990s and how long this trend might continue. For example, some scholars contend that secularization is the result of increasing “existential security” – as societal conditions improve and scientific advances allow people to live longer lives with fewer worries about meeting basic needs, they have less need for religion to cope with insecurity (or so the theory goes).8 Others say that in the U.S., an association of Christianity with conservative politics has driven many liberals away from the faith. Still other theories involve declining trust in religious institutions, clergy scandals, rising rates of religious intermarriage, smaller families, and so on. When asked, Americans give a wide range of reasons for leaving religion behind, Pew Research Center has found.
Generational ‘snowball’
Whatever the deeper causes, religious disaffiliation in the U.S. is being fueled by switching patterns that started “snowballing” from generation to generation in the 1990s. The core population of “nones” has an increasingly “sticky” identity as it rolls forward, and it is gaining a lot more people than it is shedding, in a dynamic that has a kind of demographic momentum.
Christians have experienced the opposite pattern. With each generation, progressively fewer adults retain the Christian identity they were raised with, which in turn means fewer parents are raising their children in Christian households.
One way of gauging the momentum behind the U.S. switching trend is to look at the other side of the coin – the rate at which Americans retain the religion in which they were raised, as opposed to switching out. By studying retention patterns, researchers can determine whether a religious identity is becoming more or less sticky.
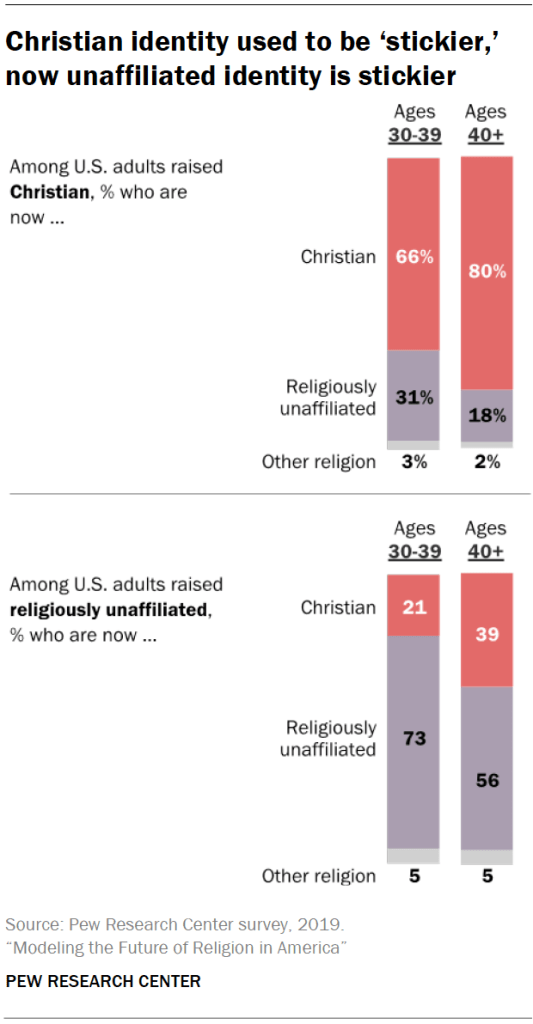
Until recently, Christian identity was stickier than unaffiliated identity, which means that the share of people who remained Christian after being raised as Christians was greater than the share of people who remained unaffiliated after being raised with no religion.
Today, Christianity still is the stickier affiliation for older Americans. But among younger adults, the unaffiliated identity has become the stickier one. Among people who are 40 and older, 80% of those raised as Christians are still Christian today, compared with just 56% of those who were raised unaffiliated (in childhood) and still do not identify with a religion today (in adulthood). However, among people in their 30s, only 66% of those raised Christian are still Christian today, compared with 73% of those raised unaffiliated who still are today.
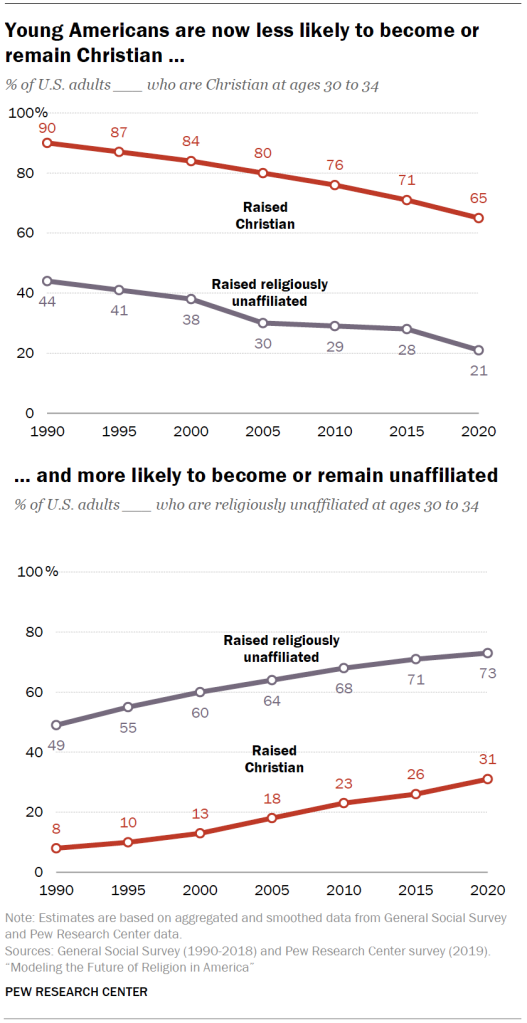
An analysis of GSS data by birth decade shows a similar pattern: Roughly 90% of people who were born in the 1960s and raised Christian were still Christian when they turned 30. Among those born in the 1970s, fewer than 85% remained Christian at 30. Among those born in the 1980s, it is about 80%. Too few of those born in the 1990s have turned 30 to estimate their switching patterns, but Christians in this youngest cohort appear to be disaffiliating even more than older cohorts.
Disaffiliation among older adults
The “snowballing” dynamic is being driven by an acceleration in switching among young Christians – those ages 15 to 29. People under 30 tend to grapple with identities of all kinds, and young adulthood is often a time of major change, when many people leave their parents’ household, start careers and form lasting romantic partnerships.
But there is a second dynamic that began in the 1990s that added a new layer of change:
Starting in the mid-1990s, it became more common for adults in middle age and beyond to discard Christian identity. Before that, changing religions after 30 was rare.
About 95% or more of people who were born prior to the 1940s and were raised Christian were still Christian from ages 30 to 65. But among those born in the ’40s, ’50s and ’60s, there has been more substantial movement away from Christianity after age 30. For example, 91% of Americans born in the 1960s were still Christian at age 30, but 83% identify as Christian today. Recent switching among older U.S. adults may be the result of a period effect (when something about the environment affects people of all ages for a period of time, such as the COVID-19 pandemic’s consequences for the mental and physical health of people of all ages). It might also be the result of a tipping point: Once Christians began to lose their overwhelming majority, people of all ages who had ties to Christianity – but did not attend church, pray often or see religion as an important part of their lives – may have begun to identify as unaffiliated in larger numbers. As “nones” grew in size and visibility, being unaffiliated may have become more socially acceptable in some circles, opening the floodgates to further disaffiliation.
While this pattern is new – and it is unclear how long it might last – it indicates that disaffiliation is extending into segments of the population that may have been unaffected in the past. (For more information about late-adult switching, see Appendix B.)
Education, politics and geography tied to differences in religious switching
A closer look at the characteristics of adults who have left Christianity and are now religiously unaffiliated indicates that other traits – such as age, gender, education, political identity and region of residence – also are tied to disaffiliation.
Age
U.S. adults who have moved away from Christianity are younger, on average, than those who have remained Christian after a Christian upbringing. More than a quarter of former Christians (27%) are under 30, compared with 14% of all adults who were raised Christian and remain Christian. This age pattern aligns with a decades-long trend in which each cohort of young adults is less religiously affiliated than the preceding one.
Gender
Americans who have moved away from Christianity are more likely to be men, while women are more likely to retain their Christian identity. A slight majority of U.S. adults who were raised Christian and are now unaffiliated (54%) are male. Among people who have remained Christian, 57% are women.
Education
People who have become unaffiliated after a Christian upbringing are a little more likely to have graduated college than those who remain Christian, with 35% and 31%, respectively, holding college degrees. This reflects a broader pattern: In the U.S., people with higher levels of educational attainment tend to be less religious by some traditional measures, such as how often they pray or attend religious services.
Politics
Seven-in-ten adults who were raised Christian but are now unaffiliated are Democrats or Democratic-leaning independents, compared with 43% of those who remained Christian and 51% of U.S. adults overall. Some scholars argue that disaffiliation from Christianity is driven by an association between Christianity and political conservatism that has intensified in recent decades.9
Geography
People who have left Christianity are underrepresented in the South, where 33% of former Christians live, compared with 42% of people who have remained Christian and 38% of U.S. adults overall.10
Those who have disaffiliated after being raised Christian are more likely than others to live in the West (28% live there, compared with 20% of those who remain Christian and 23% of all U.S. adults). Surveys often find that U.S. adults tend to be more religious, on a number of measures, in the South, and less so in the West and Northeast. This may indicate that people adapt to the religious contexts in which they live and/or sort themselves into like-minded communities.
Other drivers of change
Switching is the primary, but by no means the only, process causing religious change in the U.S. Populations can grow or shrink through a few other mechanisms. Patterns of religious transmission, migration and fertility explain some of the shift in the religious landscape in recent decades.
Transmission
The share of Christians is in decline partly because religion is not always transmitted by Christian parents to their children.
For the purposes of the projections in this report, religious identities are considered to be “transmitted” when children are raised in their parents’ religion and identify with it as early adolescents. There are a variety of reasons why children of religiously affiliated parents may be raised without a religion and, therefore, that religion is not transmitted. For example, a child may have parents without strong religious commitment, or parents with different religions, or parents who have decided to let children explore and make decisions about religion on their own.
Consider the hypothetical case of an adult survey respondent who says her mother was Christian, her father was Jewish, she was not raised in any religion, and she currently does not identify with any religion. A person like this has not switched religions, since switching is defined as leaving the religion in which one was raised. However, in this example, neither parent transmitted their religion.
By the same token, not all unaffiliated parents transmit their identity. For example, a 14-year-old child of unaffiliated parents could acquire a Christian identity outside the parental home in various ways, such as from other family members, a teacher or a friend.
In this study, transmission rates are calculated based on the mother’s religion because mothers tend to successfully transmit their religion more often than fathers do, and roughly a quarter of teens live in single-parent households, which are almost exclusively headed by mothers.
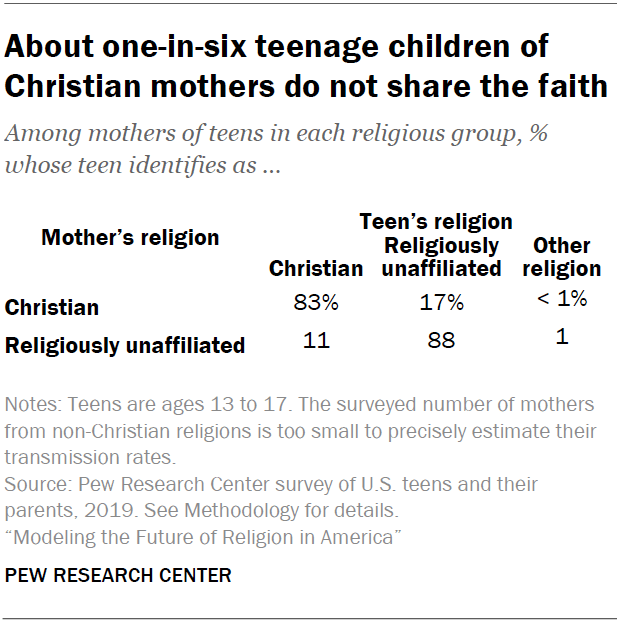
Today, transmission of the mother’s religious identity happens in the vast majority of families. In a 2019 Pew Research Center survey of teens and their parents, an overwhelming majority of both Christian and unaffiliated mothers had transmitted their religious identities to their teenagers. More than eight-in-ten Christian mothers had Christian teens, while 17% of their teens identified as atheist, agnostic or “nothing in particular,” and less than 1% said they were members of another religious group.
The teens of unaffiliated mothers show a similar pattern: 88% are unaffiliated themselves, 11% are Christians, and 1% identify with a non-Christian religion. The survey sample did not contain enough mothers who belong to non-Christian religions to report on their precise transmission rates, but their patterns seem broadly similar to those with Christian and unaffiliated mothers – the vast majority of teens raised by mothers of “other religions” also identify with a religion in this category.
Even though the shares of Christian and religiously unaffiliated mothers who transmit their affiliation (or lack thereof) are fairly similar, the impact of failed transmission in Christian families is far greater, numerically, because there are more than twice as many Christian mothers as unaffiliated ones. At these rates, and as long as Christians are the substantially larger group, many more people will adopt a religiously unaffiliated identity rather than a Christian one during childhood, which in turn increases the population share of the unaffiliated.
Migration
Migration contributes to U.S. religious change because the composition of immigrants and emigrants is not identical to that of the overall U.S. population.
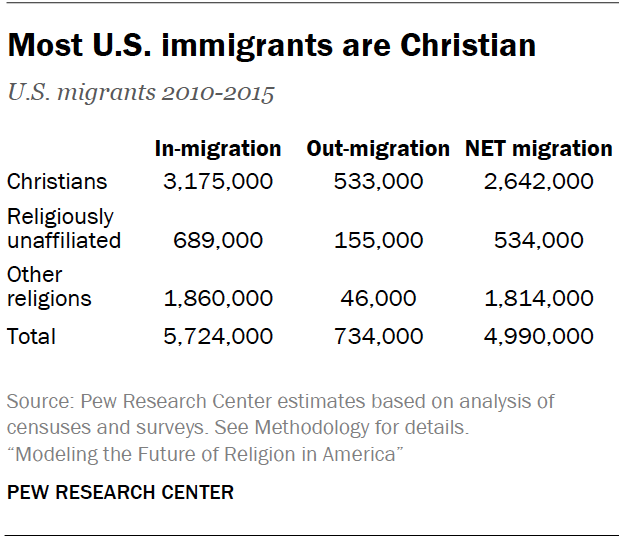
About a million immigrants come to the U.S. each year, and one-in-seven people in the U.S. were born elsewhere. In the 1990s and early 2000s, the largest number of recent arrivals to the U.S. were from Mexico and other Christian-majority countries in Central and South America.
Today, new arrivals are more likely to come from Asia. In 2018, the top country of origin for new immigrants was China (which is majority unaffiliated), followed by India (which is majority Hindu). Most of the world’s people who identify as religiously unaffiliated, Hindu, Buddhist, Sikh and Jain live in either China or India, and this is reflected in the changing profile of immigrants.
Christians still make up a majority of immigrants to the U.S., including a majority of immigrants from Mexico, the third-largest source of new immigrants in recent years. But the estimated share of new immigrants who are Christian (55%) is lower than the Christian share of the existing U.S population (64%), meaning that immigration is not boosting the Christian population share. The same is true of religiously unaffiliated people: 12% of new immigrants are estimated to be religiously unaffiliated, compared with 30% of the existing U.S. population.
But immigration is leading to growth in the share of other religions like Hindus and Muslims – 32% of new immigrants are estimated to be adherents of other religions (versus 6% of the U.S. population), according to recent data on the origin and size of migrant flows to the U.S. and an earlier Pew Research Center analysis of the typical religious composition of migrants from each country.11
Fertility
In countries with wide differences in fertility rates between religious groups, those differences can cause significant changes in religious composition over time.
Recently, religiously unaffiliated women in the U.S. have tended to have fewer children than Christians and women of other religions. In this report’s models, the average unaffiliated woman is expected to have 1.6 children in her lifetime, while the average Christian woman will have 1.9 children, and the average woman of other religions (an umbrella category that includes Jews, Muslims, Hindus, Buddhists and many smaller groups) will have 2.0 children (see Methodology for more details).
Since the U.S. has a very large population and mothers tend to transmit their religions to children, these small differences can add up to noticeable changes over time. However, higher fertility among Christians compared with the religiously unaffiliated has not been nearly enough to maintain the Christian share of the population, although it has slightly offset some of the impact of disaffiliation.
Age structures and mortality
The youthfulness of religious groups has an impact on the future that is intertwined with fertility because young populations have higher shares of people who are in, or soon will enter, their reproductive years. In other words, they have more growth potential than older populations. If two groups have identical total fertility rates, the group with the younger age structure can grow more rapidly because of the population momentum produced by having a larger share of women of reproductive age. Young populations also tend to have a smaller share of people who die each year.
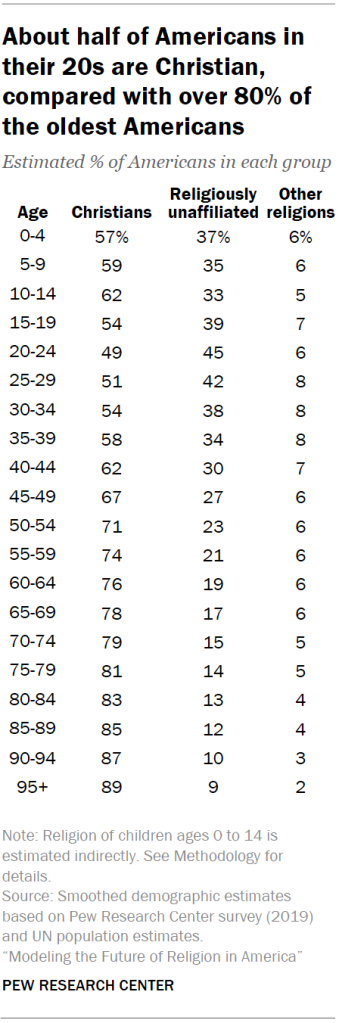
Christians are older, on average, than the unaffiliated or people of non-Christian religions. The average U.S. Christian is 43, compared with an average age of 33 among the unaffiliated and 38 among people of other religions. More than 80% of Americans older than 75 are Christian, compared with roughly half of people in their prime childbearing years (ages 20 to 34), many of whom will transmit their religion to the next generation, if past patterns hold. More than 40% of Americans between 20 and 34 are religiously unaffiliated, compared with under 15% of the oldest Americans. These are among the reasons why religious “nones” are projected to grow as a share of the U.S. population even in the scenario with no further religious switching.
Due to a lack of sufficient data on mortality differences between people in the three religious identity categories studied in this report, each group is assumed to have the same mortality patterns. In other words, for purposes of these projections, life expectancy is assumed to be similar among members of each group at a given age. It is also assumed to be rising over time, despite a dip caused by the coronavirus pandemic.12


