

Pew Research Center conducted this study to understand how the economic downturn in the COVID-19 pandemic affected the wealth of U.S. households during the pandemic. We also emphasize how the financial impact varied across poorer and richer households and within and across racial and ethnic groups.
This analysis is based on data from the U.S. Census Bureau’s 2020, 2021 and 2022 Surveys of Income and Program Participation (SIPP), the latest three years the survey was conducted. The estimates of wealth from these three surveys refer to the month of December in 2019, 2020 and 2021. SIPP collects detailed information on the economic and demographic characteristics of U.S. households. It is one of few surveys that report on the values of assets and liabilities (debt) held by households. SIPP offers the largest sample sizes compared with other surveys of household wealth.
The COVID-19 outbreak affected data collection efforts by the U.S. government in its surveys, limiting in-person data collection and lowering response rates. Both the 2020 and 2021 SIPP surveys were affected. It is possible that some measures of economic outcomes and how they vary across demographic groups are impacted by these changes in data collection.
Household wealth or net worth is the value of assets owned by every member of the household minus their debt. The terms are used interchangeably in this report. Assets include owned homes, vehicles, financial accounts, retirement accounts, stocks, bonds and mutual funds, and more. Debt refers to home mortgage loans, education loans, credit card balances, and any other loan or credit extended to the household. Net worth is negative when debt levels are greater than asset values. (Refer to the methodology for more details.)
“Poorer,” “more solvent,” “wealthier” and “richer” refer to a household’s wealth status relative to other households of the same race and ethnicity. Poorer households rank in the bottom 25% when compared with other households of the same race and ethnicity; more solvent households place from the 25th up to and including the 50th percentile; wealthier households from the 50th up to and including the 75th percentile; and the richer are in the top 25%. The bottom 1% and the top 1% are excluded prior to the ranking so extreme values do not affect estimates for poorer and richer households.
Lower, middle and upper wealth tiers refer to a household’s wealth status relative to all other households in the U.S. The middle wealth tier consists of households whose wealth lies between one-quarter to four times as much as the median wealth of U.S. households – between $41,700 and $667,500 in 2021. Households in the lower wealth tier had wealth less than $41,700, and households in the upper wealth tier had wealth more than $667,500. The wealth tier boundaries vary across years. (Dollar amounts are expressed in December 2021 prices.)
Middle-income households are those with an income that is two-thirds to double that of the U.S. median household income, after incomes have been adjusted for household size and difference in the cost of living across areas. This was about $4,800 to $14,300 monthly in December 2021, for a household of three. Lower-income households had incomes less than $4,800, and upper-income households had incomes greater than $14,300. The income tier boundaries vary across years. (Dollar amounts are expressed in December 2021 prices.)
Households are grouped by the race and ethnicity of the survey reference person, or the household head. White, Black and Asian include those who report being only one race and are not Hispanic. Multiracial includes non-Hispanics of two or more races. Hispanics are of any race. American Indian or Pacific Islander households are not covered in our analysis because of small sample sizes.
The economic downturn caused by the COVID-19 pandemic put the financial security of U.S. households at risk. The initial shock caused about 25 million workers to lose their jobs within three months, from February to April 2020, and it took about two years for the nation’s employment level to fully recover. Workers’ earnings also took a hit as consumer prices began to increase sharply in 2021.
Even so, American families made strong financial gains during the pandemic. The typical U.S. household saw its wealth increase by 37% from 2019 to 2022, after inflation, according to a recent report from the Board of Governors of the Federal Reserve System. Wealth, or net worth, is the difference between the value of assets owned by households and their debt level, and it is a key indicator of financial security.
Our new analysis examines changes in the wealth of poorer and richer families during the pandemic. We also focus on differences within and across racial and ethnic groups on these and other dimensions.
Related: Key facts about the wealth of immigrant households during the COVID-19 pandemic
We use the latest Survey of Income and Program Participation (SIPP) data from the U.S. Census Bureau. Its larger sample size – about four times that of the Federal Reserve’s Survey of Consumer Finances – allows for a deeper analysis of the well-being of demographic groups.
We start by dividing households into four groups: “Poorer,” “more solvent,” “wealthier” and “richer.” They represent a quarter each of the household population, with poorer households ranking in the bottom 25% in wealth and richer households ranking in the top 25%. We exclude the poorest 1% and the richest 1% prior to the ranking. The following are our key findings.
Changes in wealth for poorer and richer households
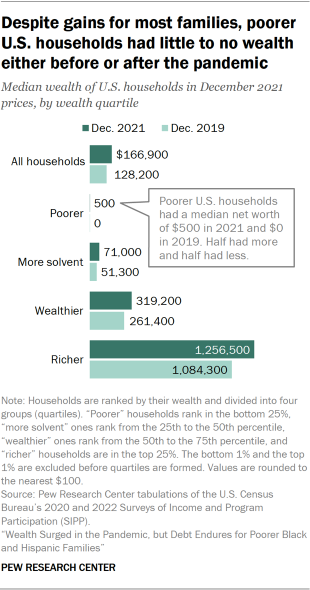
- Poorer U.S. households were likely to be in debt both before and after the pandemic. In December 2021, half of these households had a net worth of $500 or less, a modest gain from December 2019 when half had a net worth of zero or less – that is, they either had no wealth or owed more than the value of their assets. (Dollar amounts are expressed in December 2021 prices.)
- Households with more wealth saw sizable gains in their net worth from 2019 to 2021. More solvent households gained $19,700, wealthier households gained $57,800 and richer households added $172,200 to their net worths, at the median.
- The wealth of U.S. households overall increased during the pandemic. The typical American household had a net worth of $128,200 in 2019. By 2021, this had increased 30% to $166,900.
Despite pandemic-era financial gains, debt remains the norm among poorer Black households
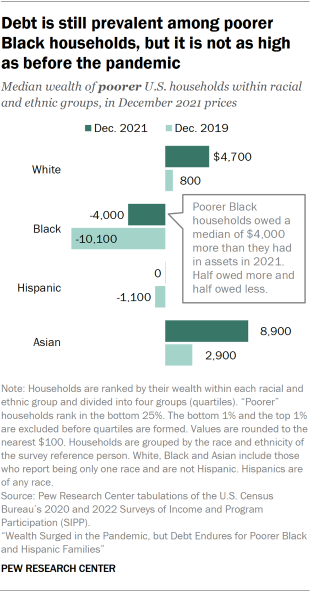
- Poorer Black households trimmed their debt level, from $10,100 in 2019 to $4,000 in 2021 at the median. But they largely remained in the red two years into the pandemic, unlike poorer White, Hispanic and Asian households.
- Poorer Hispanic households neared financial solvency in 2021. Their median net worth stood at $0 in 2021, compared with a net debt of $1,100 in 2019. But the financial gain for them was more limited than among other poorer households.
- Poorer Asian households had more wealth than other poorer households in both 2019 and 2021. Their median wealth in 2021 – $8,900 – was almost twice the median wealth of poorer White households.
Other key findings about the state of wealth inequality among U.S. households
- About one-in-four Black households overall (24%) had no wealth or were in debt in 2021, compared with about one-in-ten U.S. households (11%). Still, this was an improvement over 2019 for Black households, when 29% were in this situation.
- Among Black households, richer households held 90% of overall group wealth in 2021, greater than among other racial and ethnic groups. This share was no less than 75% among other groups. These shares do not factor in the wealth held by the richest 1% of households, who alone hold a large share of total household wealth.
- Racial and ethnic gaps in wealth remained large through the pandemic. White households had 13 times as much wealth as Black households in 2019, at the median, and nine times as much in 2021. They also had five times as much wealth as Hispanic households in 2021 and three times as much as multiracial households. But Asian households had more wealth than White households in 2021.
- The wealth gap between White and Black households is greater among lower-income households. In 2021, lower-income White households had 21 times as much wealth as lower-income Black households at the median. In contrast, middle- and upper-income White households had three times as much wealth as their Black counterparts.
- The wealth of lower- and middle-income households overall increased at a greater rate than the wealth of upper-income households from 2019 to 2021.
Why did household wealth increase during the pandemic?
Explore this report
In the following chapters, we take a closer look at the following topics:
It would not have been surprising if household wealth had fallen because of the economic slowdown during the pandemic. The median income of U.S. households decreased by 2.5% from 2019 to 2021, after adjusting for inflation, according to the U.S. Census Bureau. Thus, households might have been expected to draw down their savings amid a rise in long-term unemployment.
However, several factors helped to turn the expected narrative on its head. For one, the CARES Act provided for tax credits, or stimulus payments, to U.S. households. As a result, the after-tax income of the typical U.S. household increased 3.5% from 2019 to 2021, according to Census Bureau estimates. The stimulus payments were designed to provide greater relief for lower- and middle-income families and are credited with a reduction in the poverty rate in 2020.
The pandemic itself helped households boost their savings initially by driving a reduction in consumption. This was likely the result of social distancing and the closure of restaurants, shops and other businesses. Relatedly, research shows U.S. households had saved about $2.3 trillion more during 2020 and the first half of 2021 than what they might have saved at pre-pandemic trends. That is upwards of $15,000 for each household, on average.
Households also benefited from rising home prices, which increased 31% from December 2019 to December 2021. At the same time, mortgage rates fell to historic lows, giving homeowners an opportunity to reduce the size of interest payments. And, after an initial decline, stock prices resumed an upward climb, ending 2020 and 2021 at higher levels than the previous year.
These broader economic trends help explain two other findings of this analysis:
- The values of most assets owned by households either increased or were unchanged from 2019 to 2021.
- Overall, the gains in asset values offset any increase in household debt during the pandemic.
The trends that supported wealth building from 2019 to 2021 have either reversed direction or turned less favorable. The before-tax income of U.S. households fell 2.3% from 2021 to 2022, in inflation-adjusted dollars. After-tax income decreased even more – by 8.8% – due to the end of stimulus payments.
Households did not curtail spending in response to the sharp decrease in after-tax income. Expenditures by U.S. households increased by 9% from 2021 to 2022, running ahead of the 8% rate of inflation. This increase in spending appears to have been supported by running down the additional savings accumulated in 2020 and 2021.
The rise in asset values also moderated in 2022. Home prices increased by 5.7% from December 2021 to December 2022, but that was a fraction of the 18.9% increase seen in 2021. Mortgage rates doubled, from 3.1% at the end of 2021 to 6.4% at the end of 2022, and stock prices tumbled 19.4% over the year. However, it is important to note that the latest available estimates in our analysis are for December 2021 and do not capture the impact of economic developments in 2022.
Our data source
This analysis is based on data from the U.S. Census Bureau’s 2020, 2021 and 2022 Surveys of Income and Program Participation (SIPP), the three latest surveys. In addition to details on the income and demographic characteristics of U.S. households, SIPP reports on the values of assets and liabilities (debt) held by households.
Data on wealth in the SIPP refers to the December of the year preceding the survey date. For example, wealth estimates for 2021 in this report are from the 2022 SIPP and refer to December 2021.
The samples in SIPP consist of more than 21,000 households in the 2020 survey, nearly 24,000 in 2021, and more than 17,000 in 2022. These samples are much larger than in the Federal Reserve’s Survey of Consumer Finances (SCF), which covered 5,783 and 4,602 families in 2019 and 2022, respectively. Thus, unlike the SCF, SIPP makes it possible to analyze trends for smaller demographic groups, say, poorer and richer Black, Hispanic and Asian households. While the latest estimates from SIPP refer to December 2021, they are near in date to the estimates for 2022 from the SCF and yield full insight into trends during the pandemic.
Nonetheless, sample sizes for American Indian or Pacific Islander and multiracial households in SIPP are small. We do not present estimates for American Indian or Pacific Islander households because their sample size is as low as 130 in the 2022 SIPP and only as high as 182 in the 2020 SIPP. Estimates for multiracial households are reported but have large sampling errors. Thus, we only report estimates for multiracial households overall. For instance, while we report the share of multiracial households that were, say, homeowners in 2021 – 45% – we do not report the value of home equity for multiracial homeowners.
Refer to the methodology for more details on SIPP and specifics on the data it collects on wealth.


