
Data source
Pew Research Center’s analysis in this report is based on data from the U.S. Census Bureau’s 2020, 2021 and 2022 Surveys of Income and Program Participation (SIPP). These are the three latest years in which SIPP was conducted. It is a nationally representative survey that focuses on the income of U.S. households and their participation in government programs. SIPP is a longitudinal survey that interviews participants multiple times over a four-year period.
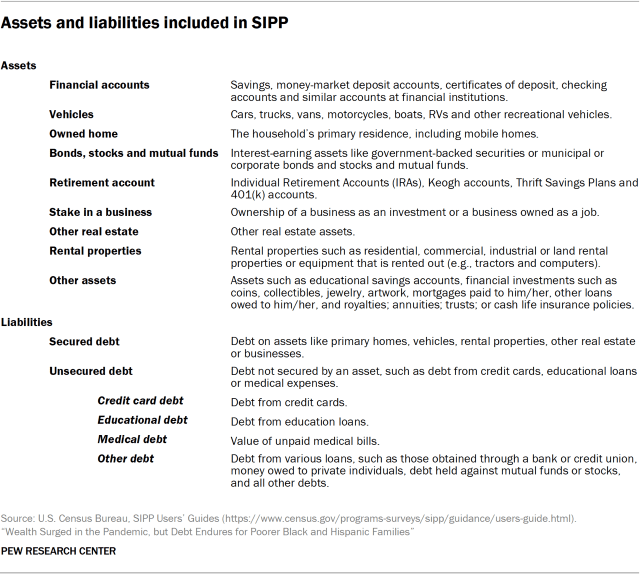
Once each year, SIPP gathers data on asset ownership and the value of assets and debts held by households. All values refer to the last day of the preceding year. For example, the wealth estimates from the 2022 SIPP refer to the net worth of households as of Dec. 31, 2021. Data on wealth is collected at both the household level, e.g., the value of the primary residence, and at the individual level, e.g., the balance in a checking account. If household-level values are not available for an item, we sum individual level estimates across all members of a household to obtain estimates for the household.
The samples that we analyze consist of more than 21,000 households in the 2020 SIPP, nearly 24,000 in 2021, and more than 17,000 in 2022. But sample sizes for American Indian or Pacific Islander households are small – as low as 130 in the 2022 SIPP and only as high as 182 in the 2020 SIPP. Thus, we do not present estimates for American Indian or Pacific Islander households.
Estimates for multiracial households are reported but have large sampling errors. Their sample size is 361 in the 2020 SIPP and 249 in the 2022 SIPP. Thus, we only report estimates for multiracial households overall. For instance, while we report the share of multiracial households that were, say, homeowners in 2021 – 45% – we do not report the value of home equity for multiracial homeowners.
The COVID-19 outbreak affected data collection efforts by the U.S. government in its surveys, limiting in-person data collection and lowering response rates. Both the 2020 and 2021 SIPP surveys were affected. It is possible that some measures of economic outcomes and how they vary across demographic groups are impacted by these changes in data collection.
SIPP, along with the Survey of Consumer Finances (SCF) and the Panel Study of Income Dynamics (PSID), is one of the leading sources of data on household wealth. A key advantage of SIPP is that it offers a much larger sample size. Thus, major racial and ethnic groups, such as White, Black, Hispanic and Asian households, are better represented.
But SIPP, compared with the SCF, is less accurate in estimating the wealth of the very richest households in the U.S. For this reason, we exclude the top 1% in some of our analysis. This has little to no effect on estimates of median levels of wealth, but it means our estimates of the share of wealth held by richer households in the U.S. are understated. Conversely, our estimates of the share of wealth held by poorer households are overstated. This effect could be large, as the Board of Governors of the Federal Reserve System estimates that the richest 1% of households hold about one-third of total household wealth in the U.S. There are numerous other differences between SIPP and the SCF, such as the capture of less commonly held assets and liabilities, which can drive a wedge between estimates from the two surveys.
Race and ethnicity
White, Black and Asian include those who report being only one race and are not Hispanic. Multiracial includes non-Hispanics of two or more races. Hispanics are of any race. American Indian or Pacific Islander households are not covered in our analysis because of small sample sizes.
Household head
A household is a group of people who occupy a housing unit together, excluding group quarters or other nonpermanent residences. In SIPP, the householder, or the reference person, is typically the first person listed as the owner or renter of the housing unit. In our analysis, households are grouped by the race and ethnicity of the reference person.
Income
Household income is the sum of monthly earnings and income received by all household members ages 15 and older. It also includes Supplemental Security Income payments received by children younger than 15. Transfers received by household members from government programs, such as Temporary Assistance for Needy Families (TANF), the Supplemental Nutrition Assistance Program (SNAP), and the Special Supplemental Nutrition Program for Women, Infants, and Children (WIC), are also included in their income. Income in SIPP is reported on a monthly basis. Our analysis uses the income reported for the month of December in each year. Annual income is estimated as 12 times the income in December.
Adjusting for inflation
The data on income and wealth are adjusted for inflation using the Consumer Price Index for All Urban Consumers (CPI-U) as reported by the Bureau of Labor Statistics. We use the CPI-U for the month of December in each year. All dollar amounts in the report are expressed in December 2021 prices.
Defining income tiers
“Middle-income” households are those with an income that is two-thirds to double the national median income. This was about $4,800 to $14,300 monthly in December 2021 for a household of three. “Lower-income” households had incomes less than $4,800 and “upper-income” households had incomes greater than $14,300. (Dollar amounts are expressed in December 2021 prices.)
The income it takes to be in the middle-income tier varies by household size, with smaller households requiring less to support the same lifestyle as larger households. We also adjust income for differences in the cost of living by geographic region, using the same procedures as the Center’s previous work on the American middle class.
Statistical testing
Estimates from SIPP are subject to sampling error. Differences in estimates between racial and ethnic groups or between years are tested for statistical significance using the replicate weight files for SIPP, following the Census Bureau’s guidance. All tests for statistical significance are conducted using 95% confidence intervals.


