
Household wealth or net worth is the value of assets owned by every member of the household minus their debt. The terms are used interchangeably in this report. Assets include owned homes, vehicles, financial accounts, retirement accounts, stocks, bonds and mutual funds, and more. Debt refers to home mortgage loans, education loans, credit card balances, and any other loan or credit extended to the household. Net worth is negative when debt levels are greater than asset values. (Refer to the methodology for more details.)
“Poorer,” “more solvent,” “wealthier” and “richer” refer to a household’s wealth status relative to other households of the same race and ethnicity. Poorer households rank in the bottom 25% when compared with other households of the same race and ethnicity; more solvent households place from the 25th up to and including the 50th percentile; wealthier households from the 50th up to and including the 75th percentile; and the richer are in the top 25%. The bottom 1% and the top 1% are excluded prior to the ranking so extreme values do not affect estimates for poorer and richer households.
Lower, middle and upper wealth tiers refer to a household’s wealth status relative to all other households in the U.S. The middle wealth tier consists of households whose wealth lies between one-quarter to four times as much as the median wealth of U.S. households – between $41,700 and $667,500 in 2021. Households in the lower wealth tier had wealth less than $41,700, and households in the upper wealth tier had wealth more than $667,500. The wealth tier boundaries vary across years. (Dollar amounts are expressed in December 2021 prices.)
Middle-income households are those with an income that is two-thirds to double that of the U.S. median household income, after incomes have been adjusted for household size and difference in the cost of living across areas. This was about $4,800 to $14,300 monthly in December 2021, for a household of three. Lower-income households had incomes less than $4,800, and upper-income households had incomes greater than $14,300. The income tier boundaries vary across years. (Dollar amounts are expressed in December 2021 prices.)
Households are grouped by the race and ethnicity of the survey reference person, or the household head. White, Black and Asian include those who report being only one race and are not Hispanic. Multiracial includes non-Hispanics of two or more races. Hispanics are of any race. American Indian or Pacific Islander households are not covered in our analysis because of small sample sizes.
In this chapter, we focus on the differences in wealth between richer and poorer members of each racial and ethnic group we studied. Our key findings are:
- The disparity in wealth between richer and more solvent households is most pronounced among Black Americans and Hispanics.
- The richer 25% of households in each group hold 75% or more of wealth within that group – not counting the top 1%, who alone hold a large share.
- Wealth disparities on both counts largely edged down during the pandemic.
The range of wealth within racial and ethnic groups
The wealth divide across poorer and richer households in the United States varies from one racial and ethnic group to another.
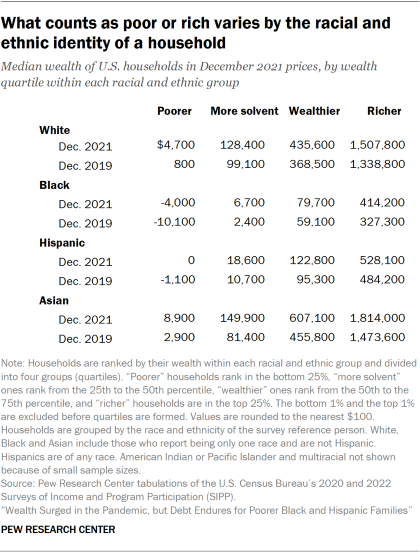
Although poorer Black households saw an improvement in their finances from 2019 to 2021, they were likely to be in debt in both years. Their debt level, beyond what they held in assets, stood at $10,100 in 2019 and $4,000 in 2021 at the median.
More solvent Black households had a modest median net worth of $6,700 in 2021, but this was more than double their wealth in 2019. Wealthier and richer Black households had $79,700 and $414,200 in 2021, respectively, and both groups saw gains over the pandemic.
Poorer Hispanic households were neither solvent nor in debt in 2021, when their median net worth stood at zero. Hispanic households that were more solvent had a net worth of $18,600 in 2021, wealthier Hispanic households had $122,800, and richer Hispanic households held $528,100. From 2019 to 2021, the net worth of more solvent Hispanic households increased by 74%, greater than the increase for wealthier Hispanic households (29%).
Poorer Asian households had a modest amount of wealth in 2021 – $8,900 – but it was three times what they had in 2019. It was also notably more than the net worth of poorer Black and Hispanic households. The wealth of Asian households also rises steeply up the wealth ladder, with more solvent Asian households having $149,900 and the richer holding $1.8 million in 2021 at the median.
The percentage increase in wealth from 2019 to 2021 was greater among less rich Asian households: 84% for the more solvent, 33% for the wealthier and 23% for richer households.
Wealth holding among White households largely mirrors the pattern among Asian households. Poorer White households were a step above insolvency in 2021, with a median net worth of $4,700, compared with $800 in 2019. More solvent White households typically had $128,400 in 2021, and richer White households were mostly millionaires, with a median net worth of $1.5 million.
In percentage terms, the increase for more solvent White households (30%) was greater than the increase for wealthier (18%) and richer (13%) White households.
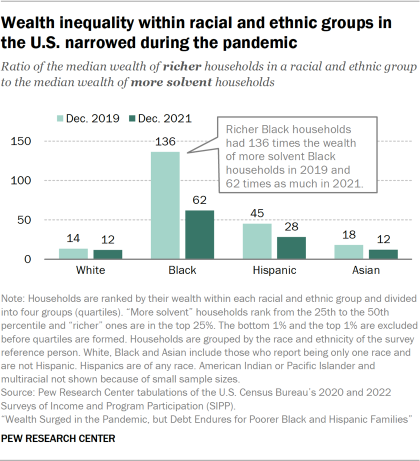
One way to measure wealth inequality within a group is to take the ratio of the wealth of richer households in that group to the wealth of more solvent households. By this measure, wealth inequality within all racial and ethnic groups examined narrowed from 2019 to 2021. (We do not measure the ratio of the net worth of richer to poorer households because poorer Black and Hispanic households have either negative or zero net worth.)
Among Black households, richer households had 62 times as much wealth as more solvent households in 2021. This was a significant decrease from a ratio of 136 in 2019. Likewise, the ratio of the wealth of the richer to more solvent among Hispanic households decreased from 45 in 2019 to 28 in 2021.
This ratio is smaller among White and Asian households, but it edged down within each group during the pandemic – from 18 in 2019 to 12 in 2021 among Asian households and from 14 to 12 among White households.
The share of racial or ethnic groups’ wealth held by richer households, not counting the top 1%
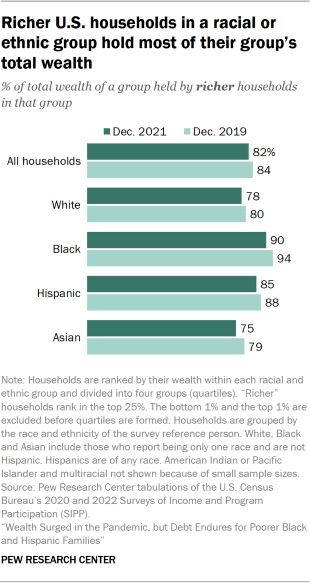
Considering the large disparities in wealth within all racial and ethnic groups, it is not surprising that rich households in each group hold most of the total wealth among a group. But their share inched downward during the pandemic.
Among all U.S. households, the richer 25% of households held 82% of the wealth in 2021, not counting the wealth in the hands of the top 1%.1 This share was less than in 2019, when it stood at 84%, but it is large by any standard.
Uneven wealth distribution is more pronounced among Black and Hispanic households. Within these two groups, the richer 25% of households held 90% and 85% of total wealth in 2021, respectively. These shares were somewhat less among White (78%) and Asian (75%) households in 2021. Only Black and White households experienced a statistically significant decrease in the share of wealth held by richer households among them from 2019 to 2021.
Households with no wealth or in debt
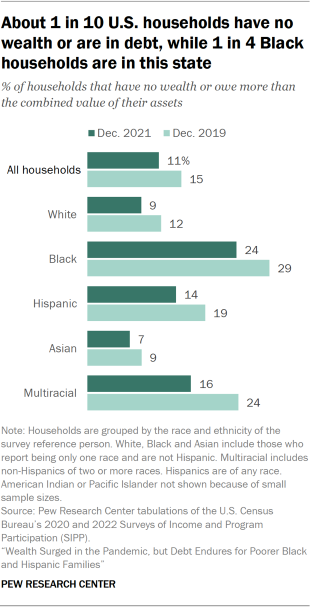
About one-in-ten U.S. households (11%) either had no wealth or were in debt – owing more than the combined value of their assets – in 2021. This was an improvement over 2019, when 15% of households were in this position.
Black households were the most likely to be in this situation: 24% of them either had no wealth or were in debt in 2021. The shares of Hispanic (14%) and multiracial (16%) households with no wealth or in debt were similar in 2021. For these groups, the situation in 2021 was either the same as or an improvement over 2019. White and Asian households were the least likely to have no wealth or be in debt in 2021 (9% and 7%, respectively).


