
Household wealth or net worth is the value of assets owned by every member of the household minus their debt. The terms are used interchangeably in this report. Assets include owned homes, vehicles, financial accounts, retirement accounts, stocks, bonds and mutual funds, and more. Debt refers to home mortgage loans, education loans, credit card balances, and any other loan or credit extended to the household. Net worth is negative when debt levels are greater than asset values. (Refer to the methodology for more details.)
“Poorer,” “more solvent,” “wealthier” and “richer” refer to a household’s wealth status relative to other households of the same race and ethnicity. Poorer households rank in the bottom 25% when compared with other households of the same race and ethnicity; more solvent households place from the 25th up to and including the 50th percentile; wealthier households from the 50th up to and including the 75th percentile; and the richer are in the top 25%. The bottom 1% and the top 1% are excluded prior to the ranking so extreme values do not affect estimates for poorer and richer households.
Lower, middle and upper wealth tiers refer to a household’s wealth status relative to all other households in the U.S. The middle wealth tier consists of households whose wealth lies between one-quarter to four times as much as the median wealth of U.S. households – between $41,700 and $667,500 in 2021. Households in the lower wealth tier had wealth less than $41,700, and households in the upper wealth tier had wealth more than $667,500. The wealth tier boundaries vary across years. (Dollar amounts are expressed in December 2021 prices.)
Middle-income households are those with an income that is two-thirds to double that of the U.S. median household income, after incomes have been adjusted for household size and difference in the cost of living across areas. This was about $4,800 to $14,300 monthly in December 2021, for a household of three. Lower-income households had incomes less than $4,800, and upper-income households had incomes greater than $14,300. The income tier boundaries vary across years. (Dollar amounts are expressed in December 2021 prices.)
Households are grouped by the race and ethnicity of the survey reference person, or the household head. White, Black and Asian include those who report being only one race and are not Hispanic. Multiracial includes non-Hispanics of two or more races. Hispanics are of any race. American Indian or Pacific Islander households are not covered in our analysis because of small sample sizes.
Most households own a combination of physical and financial assets. Physical assets include items such as a home, a car or jewelry. Financial assets include checking and savings accounts, retirement accounts, and stocks, among others. Our focus in this chapter is on the importance of the various assets to household portfolios and the debt households have taken on to either acquire assets or for other purposes. We find:
- An owned home is typically the most valuable asset for U.S. homeowners. Black and Hispanic homeowners typically derive a higher share of their wealth from owned homes than White and Asian households.
- But Black and Hispanic households trail White and Asian households in ownership of assets such as homes, retirement accounts, and bonds, stocks and mutual funds by notable margins.
- One-in-ten Black, Hispanic and multiracial households owned no assets other than a vehicle or a checking account in 2021.
- The values of most asset holdings either increased or were unchanged from 2019 to 2021.
- The increase in asset values offset any increase in household debt during the pandemic, increasing net worth.
Types of assets owned by U.S. households
The vast majority of U.S. households have a bank account or a vehicle. In 96% of households in 2021, at least one person had a financial account, such as a checking or savings account. The ownership rate varied from 90% among Black households to 99% among Asian households. The likelihood of owning a vehicle of any type ranged from 68% among Black households to 87% among White households. (Refer to the methodology for specifics on household assets and debt.)
In 2021, 62% of U.S. households lived in homes they owned as their primary residence. But homeownership is less common among Black, Hispanic and multiracial households. In 2021, 40% of Black households, 47% of Hispanic households and 45% of multiracial households owned their primary residence. In the same year, 70% of White households and 58% of Asian households lived in homes they owned.2
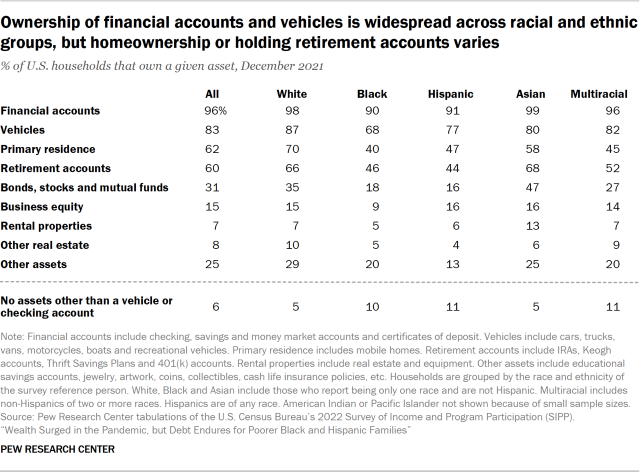
Ownership of retirement accounts, such as individual retirement accounts (IRAs) and 401(k) accounts, is about as prevalent as homeownership. Overall, 60% of U.S. households had at least one person with a retirement account in 2021. About two-thirds each of Asian (68%) and White (66%) households had retirement accounts, as did a bit more than four-in-ten Black (46%) and Hispanic (44%) households and about half of multiracial households (52%).
About one-third of White households (35%) and nearly half of Asian households (47%) possessed bonds, stocks and mutual funds in 2021. About one-in-four multiracial households had these assets, but only about one-in-five or fewer Black and Hispanic households did.
Ownership of business equity, rental properties or other real estate is less commonplace. For instance, only about one-in-ten or fewer households owned a rental property or other real estate in 2021, no matter their race or ethnicity.
Not every U.S. household has a variety of assets. In 2021, 6% of households had no assets other than either a checking account or a vehicle. Some 5% each of White and Asian households had this narrow array of assets, along with about 10% each of Black, Hispanic and multiracial households.
The rates of asset ownership, or the likelihood of having no assets other than a car or a checking account, were largely unchanged from 2019 to 2021.
The value of assets owned by households
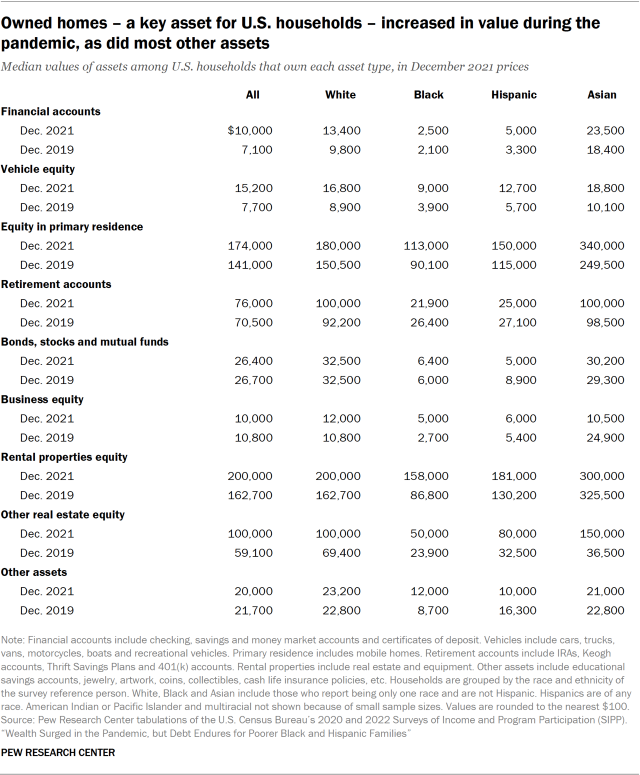
An owned primary residence and a retirement account are the two most valuable assets for U.S. households. In 2021, homeowners typically had $174,000 in equity in their homes. (Equity is the difference between the value of the home and the debt on that home.) Similarly, the typical retirement account was valued at $76,000 in 2021. As noted, about eight-in-ten households possessed at least one of these assets in 2021; 44% had both.
Financial accounts and vehicles, the two most widely owned assets, held less value in 2021 – $10,000 and $15,200 at the median for households with these assets, respectively. Bonds, stocks and mutual funds were typically worth $26,400 in 2021. For households that owned them, rental properties ($200,000) and other real estate ($100,000) were valuable, but their overall importance fades because only about 7% to 8% of U.S. households own either one. The value of other assets stood at $20,000.
These overall patterns also describe the portfolios of White, Black, Hispanic and Asian households.
Several key differences emerge when looking across racial and ethnic groups. Asian homeowners held more equity in their homes in 2021 than White, Black and Hispanic homeowners. Retirement accounts owned by Asian and White households were from four to five times as valuable as those owned by Black and Hispanic households. Notable gaps in asset values across racial and ethnic groups also exist on other fronts, such as the values of financial accounts and bonds, stocks and mutual funds.
The values of most asset holdings either increased or were unchanged from 2019 to 2021 for all racial and ethnic groups studied.
The importance of home equity
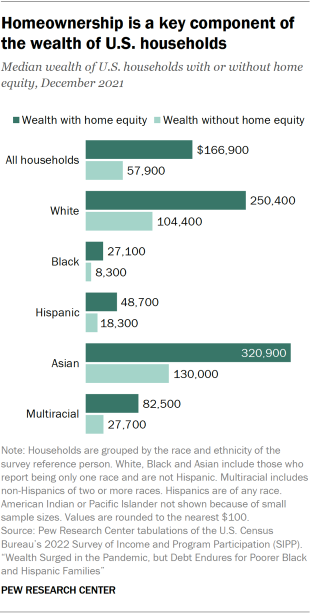
Home equity looms large in household wealth. In 2021, the median net worth of U.S. households overall stood at $166,900, counting all assets. But their median net worth without home equity included was only $57,900.
This is generally true – if home equity is excluded, median wealth decreases by about half or more for all racial and ethnic groups. For the typical Black household, net worth falls to $8,300, down from $27,100. For the typical Hispanic household, it falls to $18,300, from $48,700.
A related question is each asset’s relative contribution to household wealth, among households that own that asset.
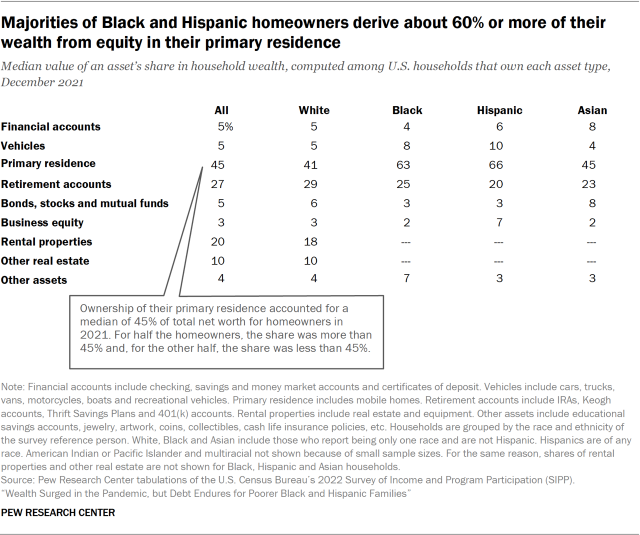
How much an owned home contributes to wealth varies across homeowners. Among U.S. homeowners overall – that is, households that own their primary residence – home equity accounted for a median of 45% of their net worth in 2021. (Half of U.S. homeowners derived more than 45% of their wealth from home equity alone, the other half derived less.)
Home equity is especially important for Black and Hispanic homeowners. In 2021, they derived 63% and 66% of their net worth from home equity, respectively, at the median. Meanwhile, home equity was typically a comparatively modest share of White (41%) and Asian (45%) homeowners’ net worth.
Other assets are less important contributors to wealth for U.S. households. Retirement accounts represented 27% of household net worth, at the median, among households in which at least one person owned a retirement account. Ubiquitous assets such as financial accounts and vehicles contributed only a median of 5% to total net worth. Equity in other forms of real estate is notable, but only for the small share of households holding those assets.
The debt level of households
In 2021, about three-in-four households, no matter their race or ethnicity, held at least some debt. They may have financed a home purchase with a mortgage, taken a loan to pay for a college education, or had a balance on their credit card to pay for goods and services.
Loans that use an asset as a guarantee, such as a home mortgage, are known as secured debt. Loans without such a guarantee, such as credit card balances, are known as unsecured debt.
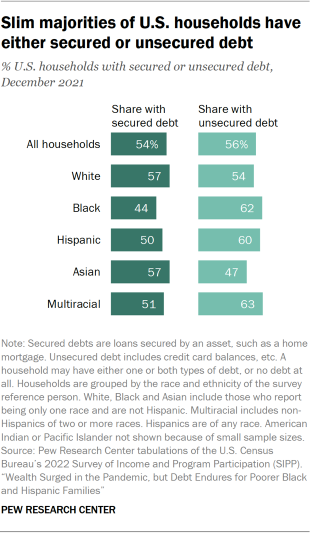
Slight majorities of U.S. households carried at least one form of debt in 2021 – 54% had secured debt and 56% had unsecured debt.
The share of households with secured debt ranged from 44% among Black households to 57% among White and Asian households. These differences are likely tied to differences in homeownership rates across groups.
About six-in-ten Black, Hispanic and multiracial households had unsecured debt, as did 54% of White households and 47% of Asian households. These shares were about the same as in 2019, before the pandemic.
In 2021, the median total debt level of U.S. households overall stood at $21,000. The debt held by White ($26,800) and Asian ($33,000) households was greater than the debt held by Black ($10,000) and Hispanic ($12,000) households. White households experienced a statistically significant decrease in debt during the pandemic, from a median of $32,500 in 2019 to $26,800 in 2021.
The level of secured debt, when it is held, is much higher. In 2021, U.S. households that held secured debt owed $103,000 at the median. The level of secured debt did vary across racial and ethnic groups. Wealthier groups, such as White and Asian households, had from $100,000 to $200,000 in secured debt. Secured debt levels among Black ($50,000) and Hispanic ($75,000) households that held some were less than those levels.
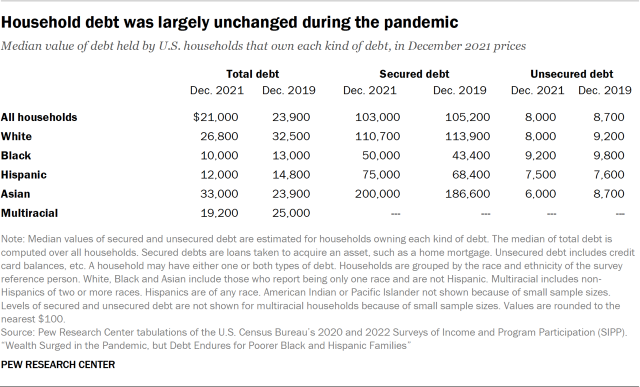
Typical Black and Hispanic households with unsecured debt had unsecured debt levels of $9,200 and $7,500 in 2021, respectively. Asian households – the least likely to hold this type of debt – had $6,000, at the median, and White households owed $8,000.
Household debt levels, whether secured or unsecured, were mostly unchanged during the pandemic. The lone exception was a decrease in the level of unsecured debt among White households, from $9,200 in 2019 to $8,000 in 2021, the only statistically significant change. Nonetheless, other observed changes in unsecured debt – which point to a decrease, except among Asian households – are consistent with the decrease in consumption levels in 2020 and the decrease in college enrollment, which may have reduced the number of education loans.
How high is household debt?
The degree to which debt weighs upon the financial health of a household depends on the ability of that household to pay back the debt. From this perspective, a key indicator is the level of the debt in relation to the value of assets owned by the household, or the debt-to-assets ratio.
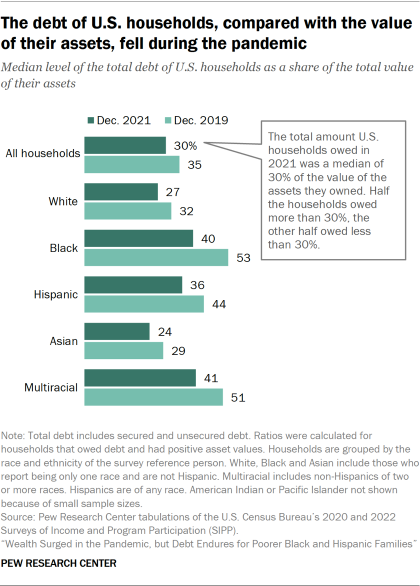
By this indicator, U.S. households became more financially solvent during the pandemic. In 2021, the total debt of U.S. households represented 30% of the value of their assets at the median. This proportion was down from 35% in 2019.
Black and Hispanic households also cut their debt load by notable margins. The median debt-to-assets ratio for Black households fell from 53% in 2019 to 40% in 2021. The ratio for Hispanic households dropped from 44% to 36% over this period. Nonetheless, they remained among the more indebted of racial and ethnic groups, by this indicator.
White and Asian households are among the most financially solvent, with debt-to-asset ratios of 27% and 24% in 2021, respectively. That is so despite the fact they hold more debt than other households, a reflection of their higher levels of wealth.
A related indicator of the financial solvency of a household is the size of its debt compared with its annual flow of income, or the debt-to-income ratio. This is relevant, say, for assessing the ability of a household to manage credit card debt, or other similar types of debt.
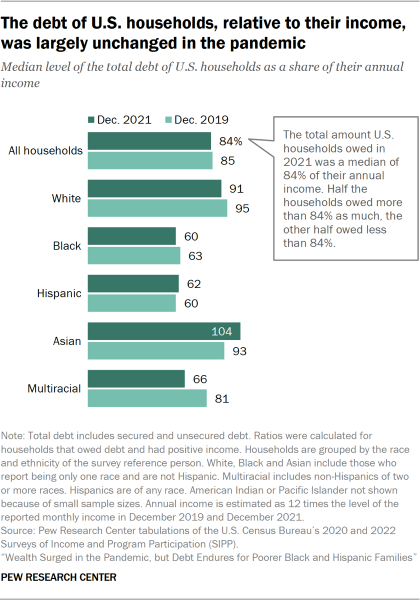
Overall, the total debt of U.S. households was about 85% as much as their annual income in both 2019 and 2021, showing no movement during the pandemic.
Notably, higher-income households, such as White and Asian households, tend to carry more debt in relation to their income than other households. Their debt-to-income ratios stood at 91% and 104% in 2021, respectively. This ratio was about 60% each among Black and Hispanic households in 2021.
In part, this may be due to differences in access to credit across racial and ethnic groups. Black and Hispanic households are more likely to be denied a home mortgage, have less access to other forms of credit, or, generally, are more likely to be “unbanked” in the face of several hurdles.


