
Household wealth or net worth is the value of assets owned by every member of the household minus their debt. The terms are used interchangeably in this report. Assets include owned homes, vehicles, financial accounts, retirement accounts, stocks, bonds and mutual funds, and more. Debt refers to home mortgage loans, education loans, credit card balances, and any other loan or credit extended to the household. Net worth is negative when debt levels are greater than asset values. (Refer to the methodology for more details.)
“Poorer,” “more solvent,” “wealthier” and “richer” refer to a household’s wealth status relative to other households of the same race and ethnicity. Poorer households rank in the bottom 25% when compared with other households of the same race and ethnicity; more solvent households place from the 25th up to and including the 50th percentile; wealthier households from the 50th up to and including the 75th percentile; and the richer are in the top 25%. The bottom 1% and the top 1% are excluded prior to the ranking so extreme values do not affect estimates for poorer and richer households.
Lower, middle and upper wealth tiers refer to a household’s wealth status relative to all other households in the U.S. The middle wealth tier consists of households whose wealth lies between one-quarter to four times as much as the median wealth of U.S. households – between $41,700 and $667,500 in 2021. Households in the lower wealth tier had wealth less than $41,700, and households in the upper wealth tier had wealth more than $667,500. The wealth tier boundaries vary across years. (Dollar amounts are expressed in December 2021 prices.)
Middle-income households are those with an income that is two-thirds to double that of the U.S. median household income, after incomes have been adjusted for household size and difference in the cost of living across areas. This was about $4,800 to $14,300 monthly in December 2021, for a household of three. Lower-income households had incomes less than $4,800, and upper-income households had incomes greater than $14,300. The income tier boundaries vary across years. (Dollar amounts are expressed in December 2021 prices.)
Households are grouped by the race and ethnicity of the survey reference person, or the household head. White, Black and Asian include those who report being only one race and are not Hispanic. Multiracial includes non-Hispanics of two or more races. Hispanics are of any race. American Indian or Pacific Islander households are not covered in our analysis because of small sample sizes.
The increase in the wealth of U.S. households from 2019 to 2021 was spread widely across racial and ethnic groups. Despite improved fortunes, Black, Hispanic and multiracial households trailed White and Asian households by large margins from the following perspectives, both before and after the pandemic:
- Their wealth relative to the wealth of White and Asian households.
- The shares of households that are in the middle or upper tiers of wealth.
How wealth varies by race and ethnicity
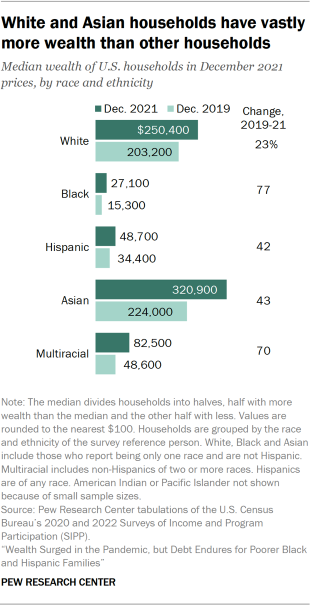
Asian households overall had more wealth than other households two years since the start of the pandemic. In 2021, Asian households had a median net worth of $320,900, compared with $250,400 for White households. The median net worth of Hispanic households ($48,700) and Black households ($27,100) was much less.
In dollar amounts, the wealth gap between White households and Black and Hispanic households increased from 2019 to 2021. For example, in 2019, the typical White household had $168,800 more in wealth than the typical Hispanic household. This gap increased to $201,700 in 2021.
In percentage terms, Black (77%), Hispanic (42%), Asian (43%) and White (23%) households all experienced strong gains in median wealth from 2019 to 2021.
What factors might explain the large wealth gaps across racial and ethnic groups that have endured for decades, if not longer?
With respect to Black households, evidence points to the role of slavery and post-slavery practices, such as segregation, that created disparate opportunities for wealth accumulation. For Hispanic households, the relative youth of the population and immigration status play a role. In turn, these factors likely contribute to the lower rates and sizes of inheritances received by Black and Hispanic households in comparison with White households.
Asian households overall have more wealth than other households partly because of the higher level of education among Asian adults. In 2021, 61% of Asians ages 25 and older had a bachelor’s degree or higher level of education, compared with 42% of White adults. As a result, the typical Asian household has a much higher income than other households, with more potential for building wealth. But the Asian American population is very diverse, and income varies widely across Asian origin groups. As shown in the following chapter, lower-income Asian households had less wealth than lower-income White households in 2021.
The wealth of White households relative to the wealth of other households
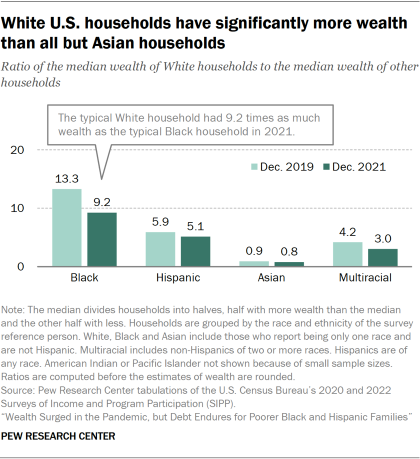
In 2021, the typical White household had 9.2 times as much wealth as the typical Black household – $250,400 vs. $27,100. This ratio stood at 13.3 in 2019, prior to the onset of the pandemic.
White households also had significantly more wealth than Hispanic households (5.1 times) and multiracial households (3.0 times) in 2021. But the median wealth of White households was about 20% less than that of Asian households.
The wealth gaps between White households and Black and Hispanic households in 2019 and 2021 are in line with recent history. But the apparent shrinking of racial and ethnic wealth gaps during the pandemic stands in contrast with what happened during the Great Recession of 2007-09.
In the Great Recession, the median wealth of White households jumped to nearly 20 times the wealth of Black households and 15 times that of Hispanic households. The key factors then were a sharp decline in home prices and a steep rise in home foreclosures, non-events during the pandemic. Black and Hispanic households saw more harm from these developments during the Great Recession because housing is a more valuable part of their collection of assets.
Households in the lower, middle or upper tiers of wealth
How does the wealth of a household compare with all other U.S. households? What shares of households are in the middle tier of wealth, and what shares are in the lower or upper tiers?
To address these questions, we grouped U.S. households into three tiers of wealth. The middle tier consists of households whose wealth lies between one-quarter and four times the median wealth of U.S. households – between $41,700 and $667,500 in 2021. Households in the lower tier had wealth less than $41,700 in 2021, and households in the upper tier had wealth more than $667,500.
Fewer than half of U.S. households (44%, or 59 million) were in the middle tier in 2021. This was so despite the wide range of the middle tier – those near the top had 16 times as much wealth as those near the bottom. At the same time, about a third of households (32%, or 43 million) were in the lower wealth tier, and about a quarter (23%, or 31 million) were in the upper tier.
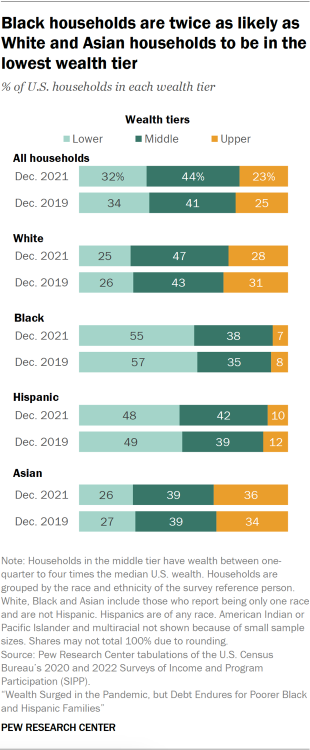
Only 45% of Black households were in either the middle or upper wealth tiers in 2021, the lowest share among the groups examined. The majority of Black households (55%) were in the lower wealth tier in 2021 – that is, they had less than $41,700 in wealth. A somewhat greater share of Hispanic households (52%) were in the middle or upper wealth tier, and 48% were in the lower wealth tier.
In contrast, more than 70% of White and Asian households were in either the middle or upper wealth tier. Roughly one-third of Asian households (36%) were in the upper tier alone, with a net worth of more than $667,500 in 2021. Slightly more than a quarter (28%) of White households were in the upper tier.
Increases in household wealth during the pandemic did lead to a more equal distribution of wealth. The share of households in the middle tier increased from 41% in 2019 to 44% in 2021. Meanwhile, the shares of households in the lower and upper wealth tiers edged down by 2 percentage points each.
A similar shift to the middle was seen in Hispanic and White households, whose shares in the middle wealth tier increased by 3 to 4 points from 2019 to 2021. However, no such change was experienced by Asian households, with their share in the middle wealth tier holding at 39%.


