
Household wealth or net worth is the value of assets owned by every member of the household minus their debt. The terms are used interchangeably in this report. Assets include owned homes, vehicles, financial accounts, retirement accounts, stocks, bonds and mutual funds, and more. Debt refers to home mortgage loans, education loans, credit card balances, and any other loan or credit extended to the household. Net worth is negative when debt levels are greater than asset values. (Refer to the methodology for more details.)
“Poorer,” “more solvent,” “wealthier” and “richer” refer to a household’s wealth status relative to other households of the same race and ethnicity. Poorer households rank in the bottom 25% when compared with other households of the same race and ethnicity; more solvent households place from the 25th up to and including the 50th percentile; wealthier households from the 50th up to and including the 75th percentile; and the richer are in the top 25%. The bottom 1% and the top 1% are excluded prior to the ranking so extreme values do not affect estimates for poorer and richer households.
Lower, middle and upper wealth tiers refer to a household’s wealth status relative to all other households in the U.S. The middle wealth tier consists of households whose wealth lies between one-quarter to four times as much as the median wealth of U.S. households – between $41,700 and $667,500 in 2021. Households in the lower wealth tier had wealth less than $41,700, and households in the upper wealth tier had wealth more than $667,500. The wealth tier boundaries vary across years. (Dollar amounts are expressed in December 2021 prices.)
Middle-income households are those with an income that is two-thirds to double that of the U.S. median household income, after incomes have been adjusted for household size and difference in the cost of living across areas. This was about $4,800 to $14,300 monthly in December 2021, for a household of three. Lower-income households had incomes less than $4,800, and upper-income households had incomes greater than $14,300. The income tier boundaries vary across years. (Dollar amounts are expressed in December 2021 prices.)
Households are grouped by the race and ethnicity of the survey reference person, or the household head. White, Black and Asian include those who report being only one race and are not Hispanic. Multiracial includes non-Hispanics of two or more races. Hispanics are of any race. American Indian or Pacific Islander households are not covered in our analysis because of small sample sizes.
The wealth of a household depends in part on its income. Here, we look at the wealth of lower-, middle- and upper-income households in the United States and examine whether wealth gaps across racial and ethnic groups are different within each income tier. We find that:
- Overall, lower- and middle-income households experienced faster growth in their wealth than upper-income households during the pandemic.
- Wealth gaps between White households and Black and Hispanic households are greater among lower-income households.
The wealth of U.S. households by income tier
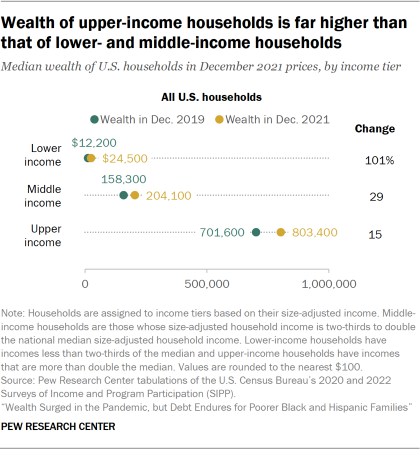
There is a wide gulf between the wealth of lower- and upper-income U.S. households. In 2021, the typical upper-income household had a median net worth of $803,400. This was 33 times as much as the wealth of the typical lower-income household ($24,500). The wealth of middle-income households stood at $204,100, only about one-fourth the wealth of upper-income households.
The separation between upper- and lower-income households was even greater in 2019, when upper-income households had 58 times as much wealth. But the wealth of lower-income households increased at a faster rate during the pandemic – 101% vs. 15% for upper-income households. Middle-income households saw their net worth increase by 29% from 2019 to 2021.
In our analysis, “middle-income” households are those with an income that was two-thirds to double the national median income. This was about $4,800 to $14,300 monthly in December 2021 for a household of three. “Lower-income” households had incomes less than $4,800, and “upper-income” households had incomes greater than $14,300. The income it takes to be middle income varies by household size, with smaller households requiring less to support the same lifestyle as larger households. (Dollar amounts are expressed in December 2021 prices.)
Lower-income households
The median wealth of each income tier conceals considerable variation across racial and ethnic groups within each tier.
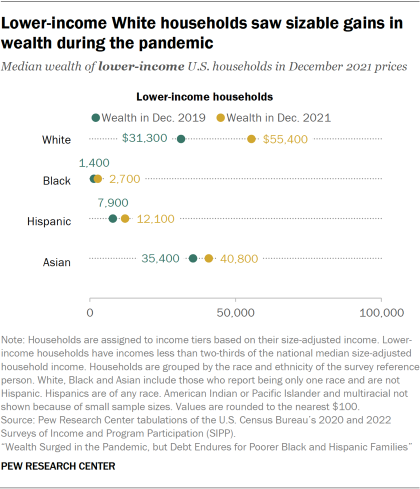
In 2021, the typical lower-income White household had a net worth of $55,400, while the typical lower-income Asian household had $40,800. The net worth of lower-income Black and Hispanic households was much less. Black households – with a median net worth of $2,700 – were barely above water financially, and lower-income Hispanic households held only $12,100 in net worth.
Lower-income White households saw their net worth increase by $24,100 during the pandemic, a sizable step up from $31,300 in 2019. But lower-income Black, Hispanic and Asian households did not experience significant changes in wealth from 2019 to 2021.
Middle-income households
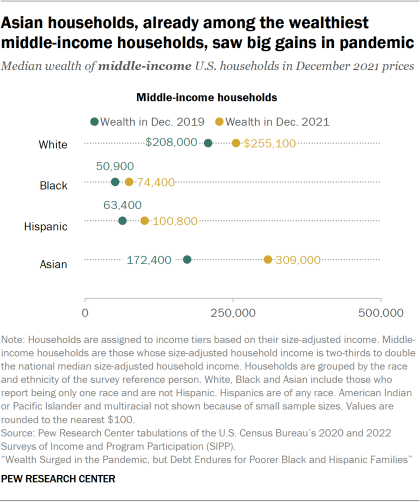
In 2021, the median net worth of middle-income Asian ($309,000) and White ($255,100) households exceeded the net worth of Black ($74,400) and Hispanic ($100,800) households by large margins.
Middle-income Asian households’ net worth increased by $136,600 from 2019 to 2021. Meanwhile, the net worth of White and Hispanic households in this income tier increased by $47,100 and $37,400, respectively.
The wealth of middle-income households is considerably greater than the wealth of lower-income households. Middle-income Black households had 28 times as much wealth as lower-income households in 2021, although this is more a consequence of the very low level of wealth among lower-income Black households. Middle-income Hispanic and Asian households had about eight times as much wealth as their lower-income counterparts in 2021, and middle-income White households had about five times as much.
Upper-income households
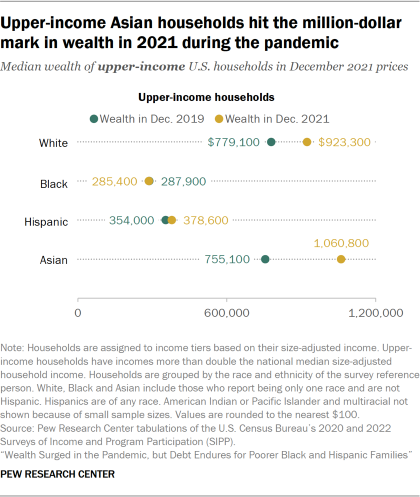
The wealth of upper-income Asian and White households hovered around the million-dollar mark in 2021 – Asian households had $1.1 million and White households had $923,300 at the median. These two groups were also about as wealthy as each other in 2019.
The net worth of upper-income Hispanic households was close to $350,000 in both 2019 and 2021. Upper-income Black households had a net worth of about $285,000 in both years.
The rise in median household wealth from the middle to the upper income tier is remarkably similar across racial and ethnic groups. Upper-income White, Black, Hispanic and Asian households all had between three to four times as much wealth as their middle-income counterparts in 2021. The balance was similar in 2019, when upper-income households had anywhere from four to six times as much wealth as middle-income households, depending on race and ethnicity.
Racial and ethnic wealth gaps by income tier
Differences in wealth between White households and Black and Hispanic households do not go away even among those with similar levels of income. And these gaps can still be large.
Most notably, the median wealth of lower-income White households was about 21 times the median wealth of lower-income Black households in 2021. This was not much different than in 2019, when White households had about 22 times as much. In the lower income tier, White households also had about five times as much wealth as Hispanic households in 2021.
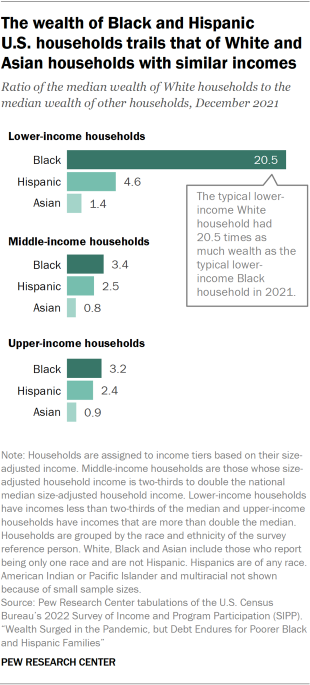
Sizable racial and ethnic gaps in wealth persist among middle- and upper-income households. In these two tiers, White households had about three times as much wealth as Black households and double to triple the wealth of Hispanic households in 2021. These ratios were no different than in 2019.
There were no significant differences in wealth between White and Asian households in any income tier in either 2019 or 2021.
Overall, the persistence of wealth gaps across White households and Black and Hispanic households within the same income tiers underlines the role of other factors in creating these gaps. As noted, this list includes, but is likely not limited to, the role of slavery and post-slavery practices, differences in age across groups, immigration status, and differences in inheritance patterns.
The gaps in wealth within income tiers are compounded by the fact that Black and Hispanic households are much more likely than White and Asian households to be in the lower income tier and much less likely to be in the upper income tier. For example, a related study by the Center estimates that 41% of Black adults and 40% of Hispanic adults lived in lower-income households in 2021, compared with 24% of White adults and 22% of Asian adults. Thus, low levels of wealth are much more prevalent among Black and Hispanic households than among White and Asian households.


