Asians in the United States trace their origins to a vast continent that spans more than 20 countries in East and Southeast Asia and the Indian subcontinent. This geographic diversity translates into multiple ways Asians in the U.S. personally describe their own identities. Some choose to identify with their ethnic origins such as Filipino or Korean or Chinese, some with the pan-ethnic label Asian, some with a regional identity such as South Asian and others with an American identity. Asians in the U.S. also sometimes chose to combine their racial or ethnic identities with American, such as Asian American or Vietnamese American respectively.
In the new Pew Research Center survey, Asian adults were asked about how they describe their identity most often. They were also asked which regional groups from the continent of Asia they would consider to be Asian. In addition, the survey explored how others would describe them when walking past them on the street.
How Asians in the U.S. describe their identity
Asians living in the U.S. are often described as a single group, often with the pan-ethnic label Asian American. However, when asked how they describe themselves, U.S. Asian adults place greater emphasis on their ethnic origins rather than pan-ethnic or regional labels, according to the new survey.
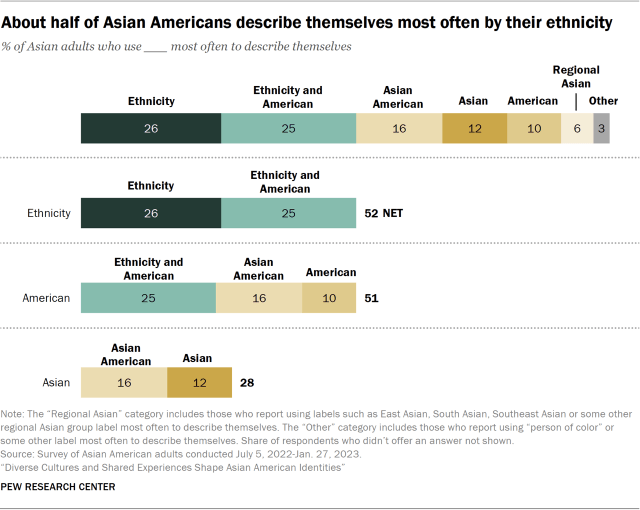
About half (52%) of Asian adults say they describe themselves most often by their ethnic origin, either alone (26%) such as Japanese or Korean or in combination with American (25%) such as Vietnamese American.
Still, some Asian adults use pan-ethnic labels. According to the survey, 28% say they describe themselves most often using the pan-ethnic label Asian, either alone (12%) or as Asian American (16%).
And while just 10% say they most often use American on its own to describe their identity, 25% use their ethnic origin combined with American and 16% use Asian American. Altogether, about half (51%) of Asian adults use American one of these three ways when describing their identity.
Another 6% say they use a regional Asian pan-ethnic label such as South Asian or Southeast Asian to describe themselves most often.
Use of ethnic origin labels among the largest origin groups
About half or more of adults from five of the six largest Asian origin groups use their ethnic label, either alone or together with American, most often to describe their identity. About two-thirds of Korean (66%) and Vietnamese (64%) adults say they do so, while about six-in-ten Indian and Filipino adults do (62% and 61% respectively). About half of Chinese adults (51%) say the same. By contrast, just 34% of Japanese adults say they use Japanese or Japanese American to describe their identity.
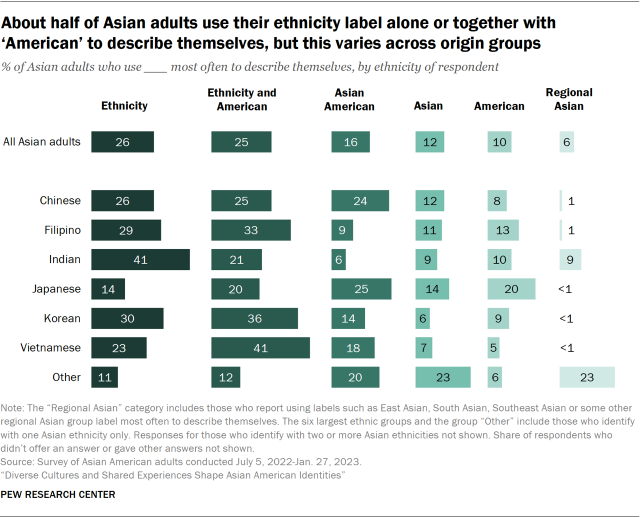
But these broad results mask some important patterns. Indians in the U.S. are the most likely of the largest Asian groups to say they most often use their ethnic identity term, without the addition of American, to describe themselves. Some 41% of Indian adults do this, calling themselves most often Indian. By contrast, Japanese adults (14%) are least likely of the six most populous Asian ethnic groups to describe themselves by ethnicity alone.
Meanwhile, about four-in-ten Vietnamese adults (41%) say they most often describe their identity with their ethnic origin and the label American. Just one-in-five Indian (21%) and Japanese (20%) adults say they do the same.
Use of pan-ethnic and regional Asian labels
Japanese and Chinese adults are more likely than other large Asian origin groups to use the pan-ethnic labels Asian or Asian American. Some 39% of Japanese adults say they do so, as do 35% of Chinese adults. These are higher shares than among Vietnamese (25%), Filipino (20%), Korean (20%) or Indian (15%) adults.
When it comes to describing their identity regionally (such as East Asian, South Asian or Southeast Asian), Indian adults (9%) are more likely to identify this way compared with the other five most populous Asian groups.
The less populous Asian origin groups, those categorized as “Other” in this report, are more likely than Asian adults overall to say they describe themselves most often as Asian (23% vs. 12%).4 And one-in-five Asian adults (20%) in these less populous Asian origin groups use the term Asian American most often to describe themselves, while 16% of Asian adults overall say the same.
The less populous Asian origin groups are also more likely to describe themselves using a regional Asian identity (such as Southeast Asian) when compared with all Asian adults (23% vs. 6%).
Use of ethnic identity labels falls as Asian immigrants spend more time in the U.S.
Nativity is an important factor in explaining differences in the terms Asian adults use to describe their identity. The majority of Asian immigrants (56%) either describe themselves most often with their ethnicity alone (31%) or ethnicity in combination with American (25%), according to the new survey. By comparison, fewer Asian adults born in the U.S. (41%) use their ethnicity in either of these ways, with 15% saying they most often use their ethnicity on its own to describe themselves and another 26% saying they use their ethnic label and American together.
Overall, about two-thirds (68%) of Asian adults are immigrants, according to a Pew Research Center analysis of 2021 U.S. government data. Among adults in the largest six origin groups, Indians (83%) have the highest share who are immigrants, while Japanese adults (30%) have the lowest share. Japanese adults are also the only group among the largest six who are majority U.S. born.
In the new survey focused on Asian Americans, the use of ethnicity to describe their identity decreases among Asian immigrants the longer they live in the United States. About 54% of those who have been in the U.S. for 10 years or less use their ethnicity alone to describe their identity most often, compared with 21% of those who have been in the U.S. for 21 years or more.
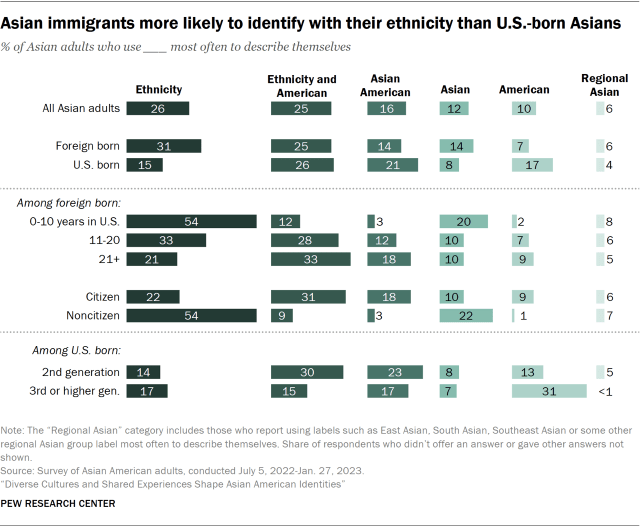
The use of ethnic origin identities decreases across immigrant generations as well, according to the survey. For example, Asian adults’ use of ethnicity combined with American to describe themselves decreases from 30% among the second generation (those born in the U.S. to at least one immigrant parent) to 15% among the third or higher generations (born in the U.S. to U.S.-born parents).
Additionally, 44% of second-generation Asian adults describe themselves with their ethnicity alone or in combination with American, and 32% of third- and higher-generation Asian adults say the same.
As use of ethnic origin terms decreases across immigrant generations, the use of terms describing American identity increases. Third- and higher-generation Asian adults are more likely to say they describe themselves most often as American alone (31%) than those who are second generation (13%) or are immigrants (7%).
Among Asian immigrants, those who acquired U.S. citizenship through naturalization (9%) are more likely than those who do not have U.S. citizenship (1%) to most often describe themselves as American alone. Asian immigrants who are naturalized U.S. citizens are also more likely than non-U.S. citizens to use the terms Asian American (18% vs. 3% respectively) or their ethnicity in combination with American (31% vs. 9%).
The pan-ethnic term Asian American rises in use among immigrants the longer they live in the country. Only 3% of those who immigrated within the last 10 years describe themselves as Asian American, compared with 18% of those who have been in the U.S. for 21 years or more.
In their own words: Qualitative research findings related to how Asians in the U.S. describe themselves
In a 2021 Pew Research Center qualitative research study of Asian Americans, the following findings were related to some of the survey findings on how Asians in the U.S. identify:
- Many Asian Americans shared how the pan-ethnic Asian label doesn’t necessarily fit them. They described the Asian label as too broad or too ambiguous, and said it lumps many diverse groups together. Others mentioned that the label Asian can be interpreted as specific to origin groups from East Asia, rather than other groups from across Asia.
- For Indians in the U.S., some focus group participants mentioned how they used the South Asian label to avoid confusion with Native Americans.
- Asian Americans from smaller ethnic groups said they default to “Asian” since their groups are less recognizable.
- There are several reasons why Asian adults would identify as American, including acquiring citizenship, being born in the U.S., and culturally feeling American.
Asian adults and the general public agree: U.S. Asians have many different cultures
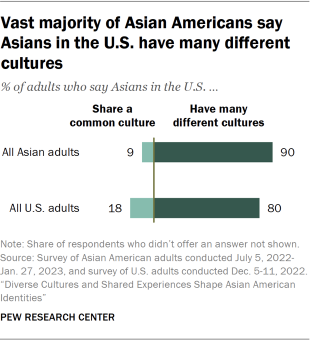
The vast majority of Asian Americans (90%) say Asians in the U.S. have many different cultures, rather than share a common culture. This is 10 percentage points higher than the share of the U.S. general public (80%) who say the same. On the other hand, only 9% of Asian adults say Asians in the U.S. share a common culture, which is a lower share than among the public overall (18%).
Whom do U.S. Asians consider Asian?
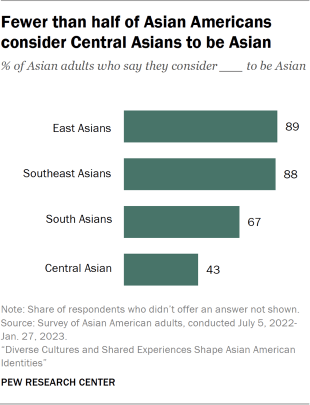
The pan-ethnic label Asian encompasses a diversity of geographic origins and ethnic groups, and it has different meanings for different people. In the new survey, Asian adults were asked if they considered each of the following groups to be Asian: East Asians (for example, Chinese or Koreans), South Asians (such as Indians or Pakistanis), Southeast Asians (for instance, Vietnamese or Filipinos) and Central Asians (such as Afghans or Kazakhs).
The vast majority of Asian adults say they consider East Asians (89%) and Southeast Asians (88%) to be Asian, while a smaller majority (67%) say the same for South Asians. On the other hand, only 43% of Asians in the U.S. consider Central Asians to be Asian.
Prior to the 2020 decennial census, Central Asians, such as Afghans and Kazakhs, were not categorized as Asian by the U.S. Census Bureau. Beginning with the 2020 census and the 2020 American Community Survey, the bureau revised the list of origins included in the definition of Asian. Before, the westernmost country that was considered “Asia” was Pakistan. Under the new classifications, Afghans and Central Asians (Kazakhs, Kyrgyz, Tajiks, Turkmen and Uzbeks) are considered Asian. Previously, individuals with these origins had been considered White. People from other Asian countries west of the Caspian Sea – Azerbaijan, Armenia and Georgia – are still coded as White by the Census Bureau, as are Iranians and others with origins in Southwest Asia (such as Lebanon and Saudi Arabia).
About half of Indian adults consider Central Asians as Asian, and nearly all see South Asians as Asian
Roughly half of Indian adults (56%) consider Central Asians to be Asian. They are the most likely to say this among the six largest Asian origin groups. A similar share of Asian adults from less populous origin groups (53%) say they consider Central Asians to be Asian.
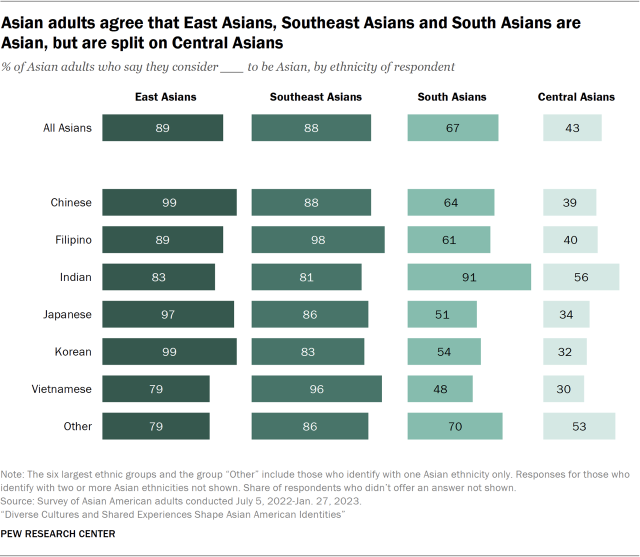
When it comes to whether South Asians are part of the broader Asian category, Indian adults (91%) are more likely than the other groups to consider South Asians to be Asian. Smaller majorities of Chinese (64%) and Filipino (61%) adults say the same. And about half of Korean (53%), Japanese (51%) and Vietnamese (48%) adults consider South Asians to be Asian.
A majority of Asian adults say others would describe them as Asian when walking past them on the street
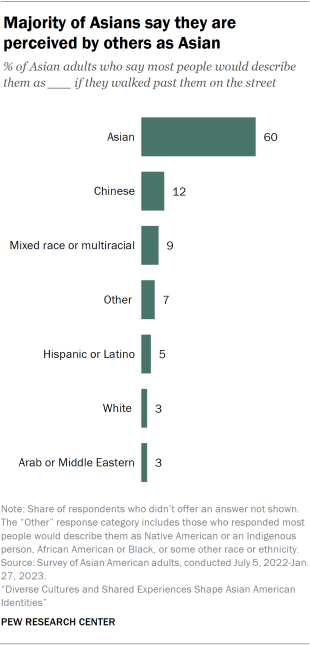
Asian adults were asked in the survey how most people would describe them if, for example, they walked past them on the street.5 Six-in-ten Asian adults say most people would describe them as Asian. About one-in-ten Asian adults (12%) say people would describe them as Chinese, and 9% say they would be considered mixed race or multiracial.
Differences by origin groups in being perceived as Asian
Korean (79%) and Vietnamese adults (75%) are the most likely of the six largest Asian groups to say people would describe them as Asian if walking past them on the street.
Meanwhile, Filipino, Indian and Japanese adults are the most likely to say they would be seen as a different race or ethnicity than Asian. Filipino adults (15%) are more likely than other groups to say they would be described as Hispanic or Latino. Indian adults are more likely to say they would be described by others as of some other race or ethnicity (16%), Arab or Middle Eastern (6%), or African American or Black (2%). And about one-in-ten Japanese adults (8%) say they would be seen as White.
Japanese and Filipino adults are the most likely of the six largest Asian origin groups – at 20% and 14% respectively – to say they would be described as mixed race or multiracial.
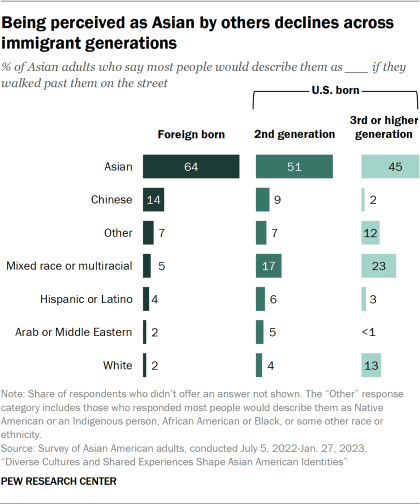
Asian immigrants (64%) are more likely than later immigrant generations to say people would describe them as Asian when walking past them on the street. Among U.S.-born Asian adults, about half (51%) who are second generation (the children of immigrant parents) and 45% of those who are third generation or higher say the same.