The May 3 update includes the full methodology appendix and a statistical profile of Mexican immigrants in the United States.

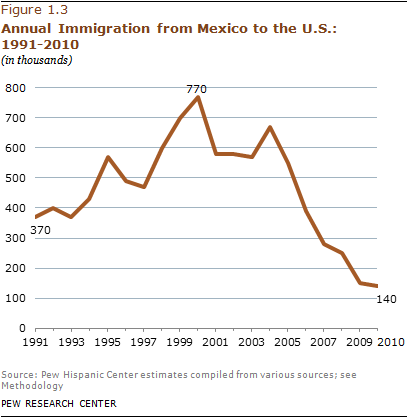
The largest wave of immigration in history from a single country to the United States has come to a standstill. After four decades that brought 12 million current immigrants—most of whom came illegally—the net migration flow from Mexico to the United States has stopped and may have reversed, according to a new analysis of government data from both countries by the Pew Hispanic Center, a project of the Pew Research Center.
The standstill appears to be the result of many factors, including the weakened U.S. job and housing construction markets, heightened border enforcement, a rise in deportations, the growing dangers associated with illegal border crossings, the long-term decline in Mexico’s birth rates and broader economic conditions in Mexico.
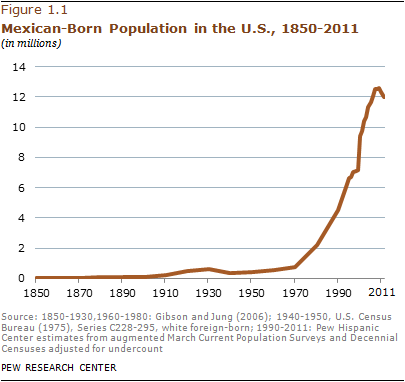
It is possible that the Mexican immigration wave will resume as the U.S. economy recovers. Even if it doesn’t, it has already secured a place in the record books. The U.S. today has more immigrants from Mexico alone—12.0 million—than any other country in the world has from all countries of the world.1 Some 30% of all current U.S. immigrants were born in Mexico. The next largest sending country—China (including Hong Kong and Taiwan)—accounts for just 5% of the nation’s current stock of about 40 million immigrants.

Looking back over the entire span of U.S. history, no country has ever seen as many of its people immigrate to this country as Mexico has in the past four decades. However, when measured not in absolute numbers but as a share of the immigrant population at the time, immigration waves from Germany and Ireland in the late 19th century equaled or exceeded the modern wave from Mexico.
Beyond its size, the most distinctive feature of the modern Mexican wave has been the unprecedented share of immigrants who have come to the U.S. illegally. Just over half (51%) of all current Mexican immigrants are unauthorized, and some 58% of the estimated 11.2 million unauthorized immigrants in the U.S. are Mexican (Passel and Cohn, 2011).
The sharp downward trend in net migration from Mexico began about five years ago and has led to the first significant decrease in at least two decades in the unauthorized Mexican population. As of 2011, some 6.1 million unauthorized Mexican immigrants were living in the U.S., down from a peak of nearly 7 million in 2007, according to Pew Hispanic Center estimates based on data from the U.S. Census Bureau. Over the same period, the population of authorized immigrants from Mexico rose modestly, from 5.6 million in 2007 to 5.8 million in 2011.

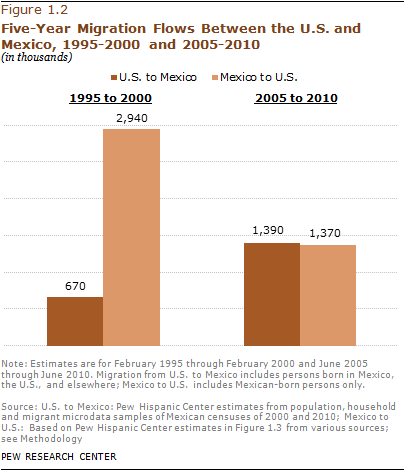
The net standstill in Mexican-U.S. migration flows is the result of two opposite trend lines that have converged in recent years. During the five-year period from 2005 to 2010, a total of 1.4 million Mexicans immigrated to the United States, down by more than half from the 3 million who had done so in the five-year period of 1995 to 2000. Meantime, the number of Mexicans and their children who moved from the U.S. to Mexico between 2005 and 2010 rose to 1.4 million, roughly double the number who had done so in the five-year period a decade before. While it is not possible to say so with certainty, the trend lines within this latest five-year period suggest that return flow to Mexico probably exceeded the inflow from Mexico during the past year or two.
Of the 1.4 million people who migrated from the U.S. to Mexico since 2005, including about 300,000 U.S.-born children, most did so voluntarily, but a significant minority were deported and remained in Mexico. Firm data on this phenomenon are sketchy, but Pew Hispanic Center estimates based on government data from both countries suggest that 5% to 35% of these returnees may not have moved voluntarily.
In contrast to the decrease of the Mexican born, the U.S. immigrant population from all countries has continued to grow and numbered 39.6 million in 2011, according to the Census Bureau’s Current Population Survey.
In addition, the number of Mexican-Americans in the U.S.—both immigrants and U.S.-born residents of Mexican ancestry—is continuing to rise. The Mexican-American population numbered 33 million in 2010.2 As reported previously (Pew Hispanic Center, 2011), between 2000 and 2010 births surpassed immigration as the main reason for growth of the Mexican-American population.
The population of Mexican-born residents of the U.S. is larger than the population of most countries or states. Among Mexican-born people worldwide, one-in-ten lives in the United States.
This report has five additional sections. The next section analyzes statistics on migration between Mexico and the United States from data sources in both countries. The third uses mainly Mexican data to examine characteristics, experience and future intentions of Mexican migrants handed over to Mexican authorities by U.S. law enforcement agencies. The fourth, based on U.S. data, examines trends in border enforcement statistics. The fifth looks at changing conditions in Mexico that might affect migration trends. The report’s last section looks at characteristics of Mexican-born immigrants in the U.S., using U.S. Census Bureau data. The appendix explains the report’s methodology and data sources.
Among the report’s other main findings from these sections:
Changing Patterns of Border Enforcement
- In spite of (and perhaps because of) increases in the number of U.S. Border Patrol agents, apprehensions of Mexicans trying to cross the border illegally have plummeted in recent years—from more than 1 million in 2005 to 286,000 in 2011—a likely indication that fewer unauthorized migrants are trying to cross. Border Patrol apprehensions of all unauthorized immigrants are now at their lowest level since 1971.
- As apprehensions at the border have declined, deportations of unauthorized Mexican immigrants–some of them picked up at work sites or after being arrested for other criminal violations–have risen to record levels. In 2010, 282,000 unauthorized Mexican immigrants were repatriated by U.S. authorities, via deportation or the expedited removal process.
Changing Characteristics of Return Migrants
- Although most unauthorized Mexican immigrants sent home by U.S. authorities say they plan to try to return, a growing share say they will not try to come back to the U.S. According to a survey by Mexican authorities of repatriated immigrants, 20% of labor migrants in 2010 said they would not return, compared with just 7% in 2005.
- A growing share of unauthorized Mexican immigrants sent home by U.S. authorities had been in the United States for a year or more—27% in 2010, up from 6% in 2005. Also, 17% were apprehended at work or at home in 2010, compared with just 3% in 2005.
Demographic Trends Related to Mexican Migration
- In Mexico, among the wide array of trends with potential impact on the decision to emigrate, the most significant demographic change is falling fertility: As of 2009, a typical Mexican woman was projected to have an average 2.4 children in her lifetime, compared with 7.3 for her 1960 counterpart.
- Compared with other immigrants to the U.S., Mexican-born immigrants are younger, poorer, less-educated, less likely to be fluent in English and less likely to be naturalized citizens.
About this Report
This report analyzes the magnitude and trend of migration flows between Mexico and the United States; the experiences and intentions of Mexican immigrants repatriated by U.S. immigration authorities; U.S. immigration enforcement patterns; conditions in Mexico and the U.S. that could affect immigration; and characteristics of Mexican-born immigrants in the U.S.
The report draws on numerous data sources from both Mexico and the U.S. The principal Mexican data sources are the Mexican decennial censuses (Censos de Población y Vivienda) of 1990, 2000 and 2010; the Mexican Population Count (II Conteo de Población y Vivienda) of 2005; the Survey of Migration in the Northern Border of Mexico (la Encuesta sobre Migracíon en la Frontera Norte de México or EMIF-Norte); the Survey of Demographic Dynamics of 2006 and 2009 (Encuesta Nacional de Dinámica Demográfica or ENADID); and the Survey of Occupation and Employment for 2005-2011 (Encuesta Nacional de Ocupación y Empleo or ENOE). The principal U.S. data sources are the Census Bureau’s Current Population Survey (CPS) monthly data for 1994 to 2012; the CPS Annual Social and Economic Supplement conducted in March for 1994 to 2011; the American Community Survey (ACS) for 2005-2010; U.S. Censuses from 1850 to 2000; U.S. Border Patrol data on apprehensions at the U.S.-Mexico border; and the U.S. Department of Homeland Security, Office of Immigration Statistics on legal admissions to the U.S. and aliens removed or returned. The report also uses data from the World Bank and the United Nations Population Division.
This report was written by Senior Demographer Jeffrey Passel, Senior Writer D’Vera Cohn and Research Associate Ana Gonzalez-Barrera. Paul Taylor provided editorial guidance in the drafting of this report. Rakesh Kochhar and Mark Hugo Lopez provided comments on earlier drafts of the report. Seth Motel and Gabriel Velasco provided research assistance. Gabriel Velasco and Eileen Patten number-checked the report. Marcia Kramer copy edited the report text and Appendix A. Molly Rohal copy edited the report’s methodology appendix.
A Note on Terminology
Because this report views migration between Mexico and the U.S. from both sides of the border, descriptions of “immigrants” and “emigrants” or “immigration,” “emigration,” “migration flows” specify the country of residence of the migrants or the direction of the flow.
United States:
“Foreign born” refers to persons born outside of the United States, Puerto Rico or other U.S. territories to parents neither of whom was a U.S. citizen. The terms “foreign born” and “immigrant” are used interchangeably in this report.
“U.S. born” refers to an individual who is a U.S. citizen at birth, including people born in the United States, Puerto Rico or other U.S. territories, as well as those born elsewhere to parents who are U.S. citizens. U.S.-born persons also are described as “U.S. natives.”
The “legal immigrant” population is defined as people granted legal permanent residence; those granted asylum; people admitted as refugees; and people admitted under a set of specific authorized temporary statuses for longer-term residence and work. Legal immigrants also include persons who have acquired U.S. citizenship through naturalization.
“Unauthorized immigrants” are all foreign-born non-citizens residing in the country who are not “legal immigrants.” These definitions reflect standard and customary usage by the Department of Homeland Security and academic researchers. The vast majority of unauthorized immigrants entered the country without valid documents or arrived with valid visas but stayed past their visa expiration date or otherwise violated the terms of their admission.
U.S. censuses and surveys include people whose usual residence is the United States. Consequently, migrants from Mexico who are in the U.S. for short periods to work, visit or shop are generally not included in measures of the U.S. population. “Immigration” to the United States includes only people who are intending to settle in the United States.
“Removals” are the compulsory and confirmed movement of inadmissible or deportable aliens out of the United States based on an order of removal. An alien who is removed has administrative or criminal consequences placed on subsequent re-entry.
“Returns” are the confirmed movement of inadmissible or deportable aliens out of the United States not based on an order of removal. These include aliens who agree to return home.
The U.S. Department of Homeland Security uses the term “removal” rather than “deportation” to describe the actions of its Immigration and Customs Enforcement (ICE) and Customs and Border Protection (CBP) to expel foreign nationals from the U.S. “Deportations” are one type of removal and refer to the formal removal of a foreign citizen from the U.S. In addition, a foreign citizen may be expelled from the U.S. under an alternative action called an expedited removal. Deportations and expedited removals together comprise removals reported by the U.S. Department of Homeland Security.
Mexico:
In Mexican data, “U.S. born” refers only to persons born in the United States and not to the citizenship at birth.
“Return migration” is a concept based on a census or survey question about prior residence, specifically residence five years before the census or survey. A “return migrant” to Mexico is a person who lived outside of Mexico (usually in the U.S.) five years before the census or survey and is back in Mexico at the time of the survey.
“Recent migrants” are identified through a question in Mexican censuses and surveys that asks whether any members of the household have left to go to the U.S. in a prior period, usually the previous five years. The recent migrants may be back in the household or elsewhere in Mexico (in which case they have “returned” to Mexico) or they may still be in the U.S. or in another country.
“U.S.-born residents with Mexican parents” are people born in the United States with either a Mexican-born mother or father. The Mexican data sources do not have a direct question about the country of birth of a person’s mother and father. Consequently, parentage must be inferred from relationships to other members of the household. About 89-91% of U.S.-born children in the Mexican censuses can be linked with one or two Mexican-born parents, about 2% can be linked only with non-Mexican parents, and the remaining 7-9% are in households without either parent.
Both:
“Adults” are ages 18 and older. “Children,” unless otherwise specified, are people under age 18.


