How we did this
Pew Research Center conducted this study to understand how Americans are viewing national conditions and the upcoming 2020 presidential election. For this analysis, we surveyed 4,708 U.S. adults in June 2020. Everyone who took part is a member of Pew Research Center’s American Trends Panel (ATP), an online survey panel that is recruited through national, random sampling of residential addresses. This way nearly all U.S. adults have a chance of selection. The survey is weighted to be representative of the U.S. adult population by gender, race, ethnicity, partisan affiliation, education and other categories. Read more about the ATP’s methodology.
Here are the questions used for the report, along with responses, and its methodology.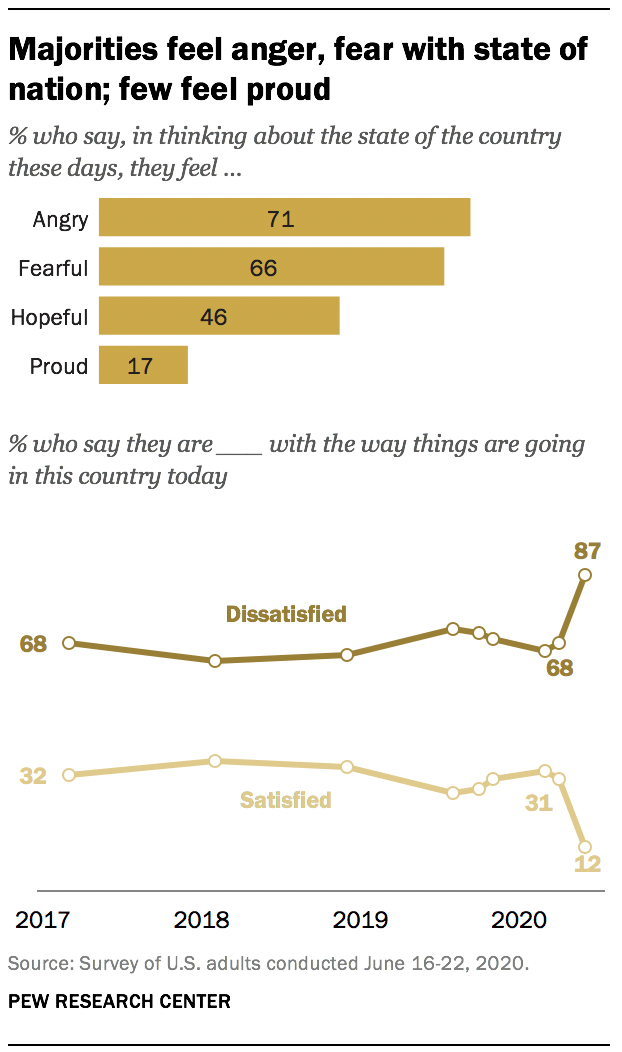
With less than five months until the 2020 elections, Americans are deeply unhappy with the state of the nation. As the United States simultaneously struggles with a pandemic, an economic recession and protests about police violence and racial justice, the share of the public saying they are satisfied with the way things are going in the country has plummeted from 31% in April, during the early weeks of the coronavirus outbreak, to just 12% today.
Anger and fear are widespread. Majorities of Democrats and Republicans say they feel both sentiments when thinking about the country, though these feelings are more prevalent among Democrats. And just 17% of Americans – including 25% of Republicans and Republican-leaning independents and 10% of Democrats and Democratic leaners – say they feel proud when thinking about the state of the country.
However, nearly half of adults (46%) say they feel hopeful about the state of the country, although a 53% majority says they are not hopeful.
In the presidential contest, Donald Trump faces a 10 percentage point deficit in his race against Joe Biden: 54% of registered voters say if the election were held today, they would support Biden or lean toward voting for him, while 44% support Trump or lean toward supporting him.
As has been the case throughout his presidency, and even during his successful campaign for the White House four years ago, Trump continues to engender strong loyalty – and intense opposition. About three-quarters of registered voters who support Trump (76%) say they view their presidential ballot primarily as a vote for the president. By comparison, only 33% of Biden voters view their vote more as an expression of support for him; about twice as many (67%) view it as vote against Trump.
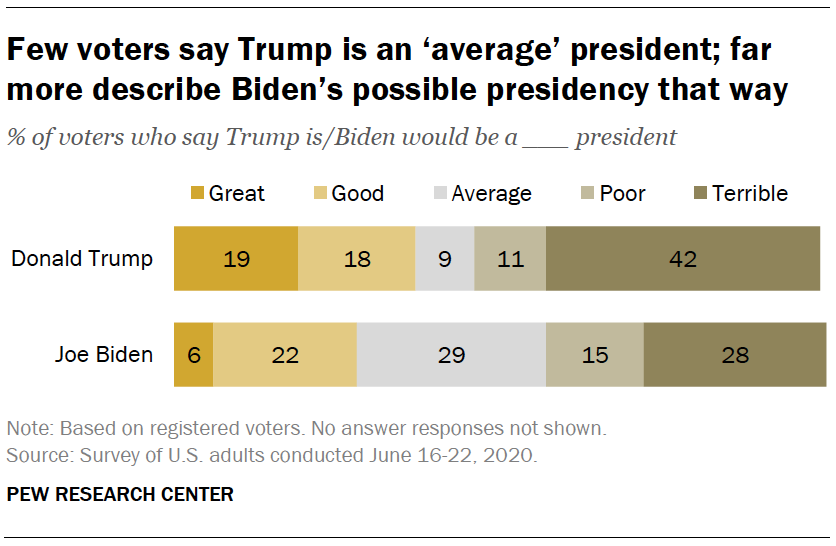
The new national survey by Pew Research Center, conducted June 16-22 among 4,708 adults, including 3,577 registered voters, finds sharp differences in how voters evaluate Trump’s presidency compared with Biden’s presidency, if he is elected. Very few voters – just 9% – say Trump is an average president; 37% say he is a good or great president; and a much larger share (53%) say he is poor or terrible, including 42% who think he is a terrible president.
Fewer voters (28%) say Biden would be a good or great president than say that about Trump as president. And compared with Trump, many more say Biden would be average; 29% say he would be an average president. However, 43% say Biden would be poor or terrible, which is 10 percentage points lower than the share expressing such negative views about Trump as president.
When it comes to voters’ views of the candidates’ personal traits and characteristics, Trump and Biden are a study in contrasts. Across six personal traits, Trump draws his lowest rating for being even-tempered. Just 25% of voters say “even-tempered” describes Trump very or fairly well; nearly three times as many (74%) say this phrase describes him not too well or not at all well. Even among voters who support Trump in the fall election, just 53% describe him as even-tempered.
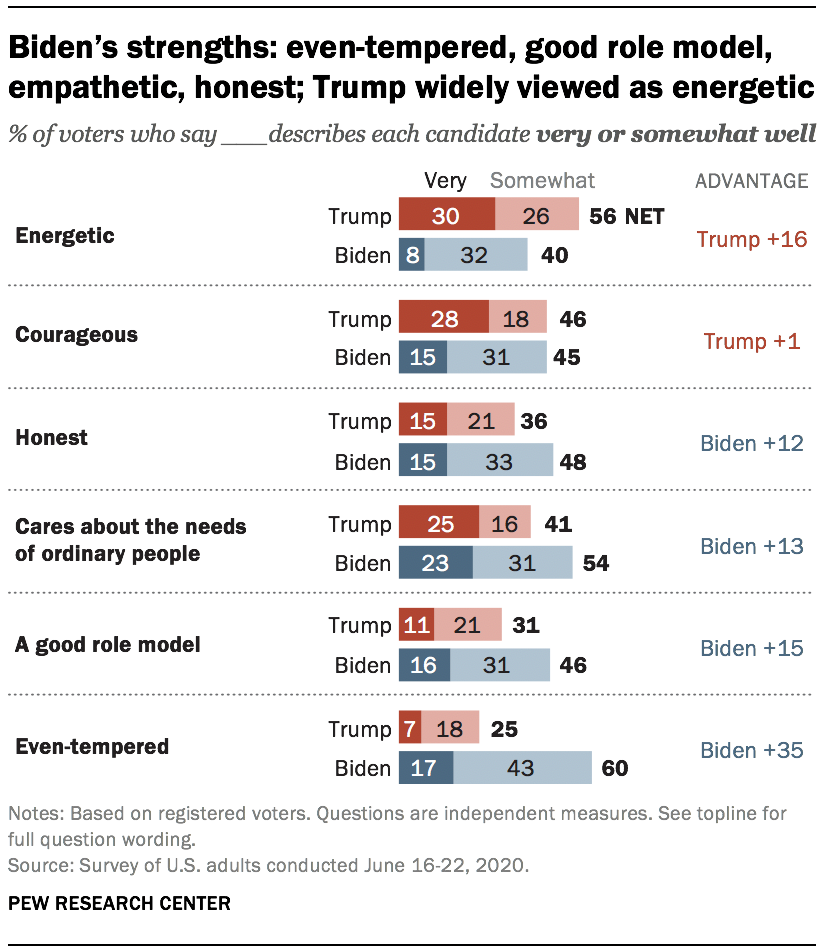
Biden gets his most positive rating for his temperament: 60% of registered voters describe him as even-tempered, more than twice the share who describe Trump this way. Moreover, a 54% majority describes Biden as caring about the needs of ordinary people; only 41% say this phrase describes Trump very or somewhat well. And more voters say Biden is a good role model and describe him as honest than say that about Trump, by 15 percentage points and 12 points, respectively.
Yet Biden has a notable weakness. Just 40% of voters describe him as energetic – his lowest rating among the six traits included on the survey. This is Trump’s most positive attribute in the eyes of voters, with a 56% majority describing him as energetic. There is only one trait of the six on which voters have similar views of the candidates; 46% say Trump is courageous while 45% describe Biden this way, although more say this description applies to Trump very well (28% vs. 15% for Biden).
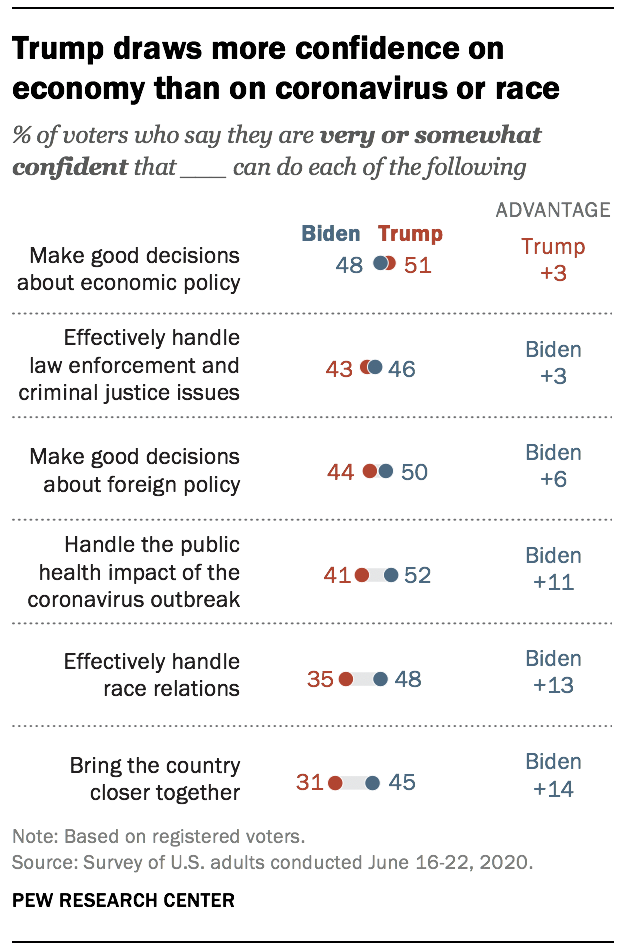
Trump also engenders relatively little confidence in handling most major issues, with one notable exception. About half of voters (51%) say they are very or somewhat confident in Trump to make good decisions about economic policy, including 33% who are very confident. Roughly as many (48%) have confidence in Biden on the economy, though just 13% are very confident.
On most other major issues, including handling the public health impact from the coronavirus outbreak, Trump draws far less confidence than Biden. And only about a third of voters (35%) have confidence in Trump to effectively handle race relations; 48% have confidence in Biden in dealing with race relations.
Trump gets his lowest rating – among six issues and challenges included in the survey – on bringing the country closer together. Only about three-in-ten voters (31%) are very or somewhat confident in Trump to unify the country; 68% are not too or not at all confident. Biden’s ratings are on balance more negative than positive, but he draws much greater confidence than Trump: 45% of voters say they are at least somewhat confident in Biden to bring the country closer, while 55% have little or no confidence in him to do this.
Other important findings
Optimism about life for future generations has increased among Black adults. In views of the current state of the country, Black and Hispanic adults are about as likely as white adults to express anger and fear. But a larger share of Black people (33%) than Hispanics (26%) or whites (22%) say life for future generations of Americans will be better than life today. And since last September, the shares of Black and Hispanic adults saying this have risen sharply – 16 points and 10 points, respectively – while remaining stable among white adults.
Trump’s approval declines to 39%. Currently, 39% of Americans approve of how Trump is handling his job as president, while 59% disapprove. Trump’s job rating has fallen from 44% in April; it stood at 45% in March. Since April, Trump’s job approval has declined among most partisan and demographic groups. Trump’s approval rating is now more negative than positive across all age groups, except adults 65 and older (48% approve, 48% disapprove). Large majorities of Black (86%) and Hispanic adults (69%) disapprove of Trump’s job performance; white adults are divided (50% disapprove, 48% approve).
The 2020 election
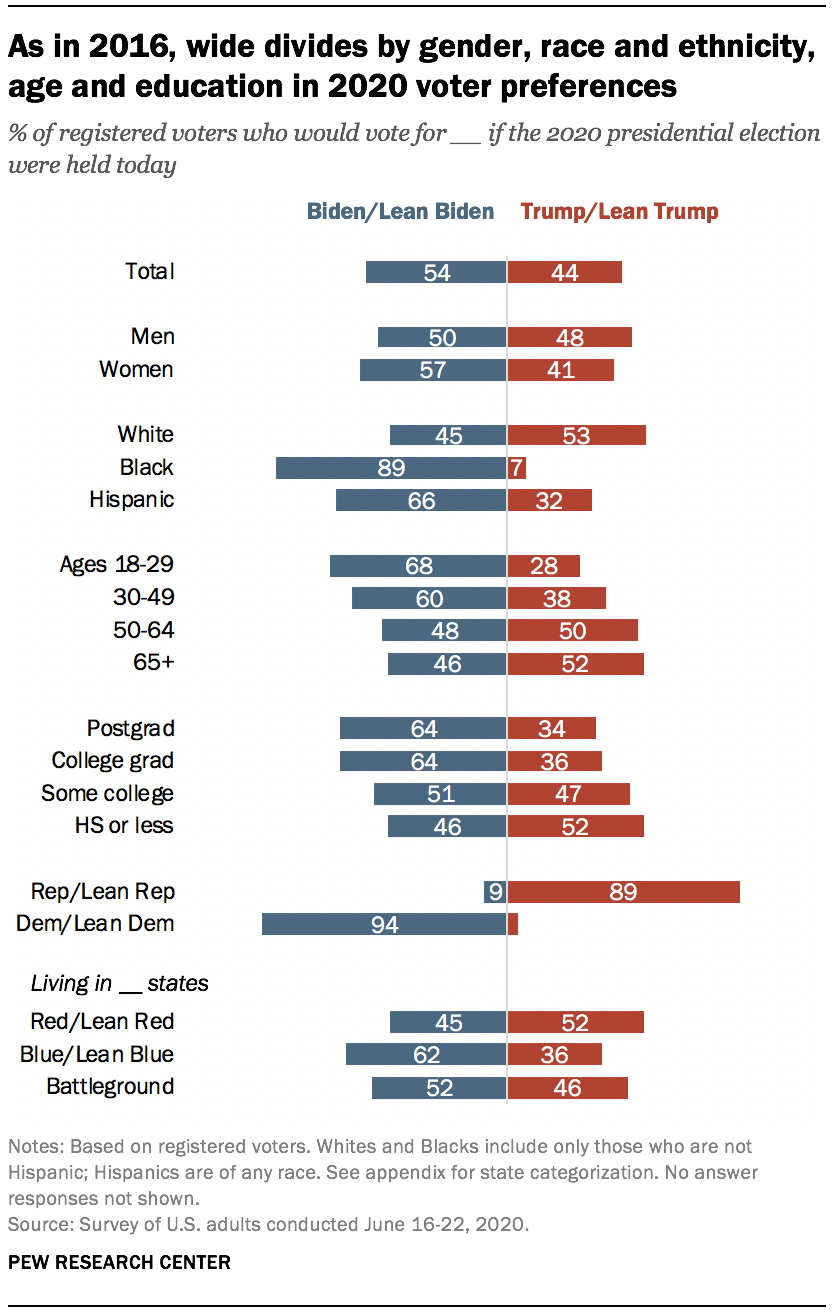
With the general election less than five months away, a larger share of registered voters say they would vote for Joe Biden than Donald Trump (54% vs. 44%) if the election were held today. For the most part, the demographic patterns in candidate preferences from the 2016 elections are evident today. (See this study for a detailed analysis of the 2016 electorate, based on validated voters.)
Among men, roughly similar shares say they would vote for Trump or Biden (48% vs. 50%), while a 57% majority of women say they would support Biden.
A larger share of white voters say they would vote for Trump (53%) than Biden (45%). Black voters favor Biden over Trump by an overwhelming margin (89% to 7%). Two-thirds of Hispanic voters (66%) support Biden, compared with 32% who back Trump.
By well more than two-to-one (68% to 28%), voters ages 18 to 29 favor Biden over Trump. Biden also has a wide advantage (60% to 38%) among registered voters ages 30 to 49. Comparable shares of voters 50 and older say, if the election were today, they would support Trump (51%) and Biden (47%).
Nearly two-thirds (64%) of voters with postgraduate experience say they would vote for Biden. The same share of those with a four-year degree also support Biden. Among voters with some college experience or no college experience, neither candidate has an advantage.
Overwhelming majorities of Republican and Democratic voters favor their party’s candidate. Among voters in Republican-leaning states, Trump has a modest advantage (52% vs 45%), while Biden’s lead is wider in Democratic-leaning states (62% vs 36%). In battleground states, neither candidate currently has a statistically significant advantage. (See the appendix for how states are categorized.)
Trump voters far more likely to see their vote as ‘for’ their candidate
Trump and Biden supporters differ substantially on whether they view their vote as more of an expression of support “for” their preferred candidate or “against” his opponent.
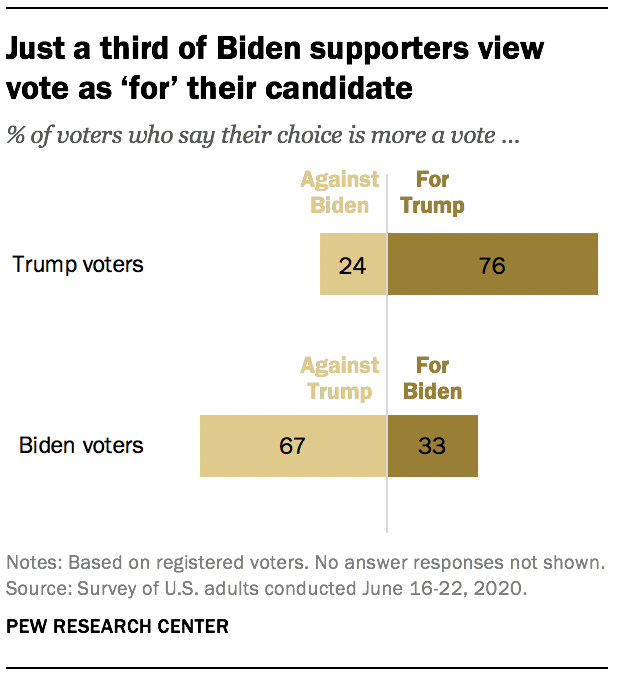
Among registered voters who say they would vote for Donald Trump, a large majority (76%) say that their choice of Trump is more a vote for Trump, while just 24% say their choice is more of a vote against Biden.
Biden supporters, by contrast, are far more likely than Trump supporters to see their vote as a vote against the opponent: 67% say their choice is more of a vote against Trump, while only about half as many (33%) say it is more of a vote for Biden.
There are sizable demographic divides among Biden supporters in views of whether they see their vote more as for Biden or against Trump. By contrast, there are only modest differences in these views among Trump voters.
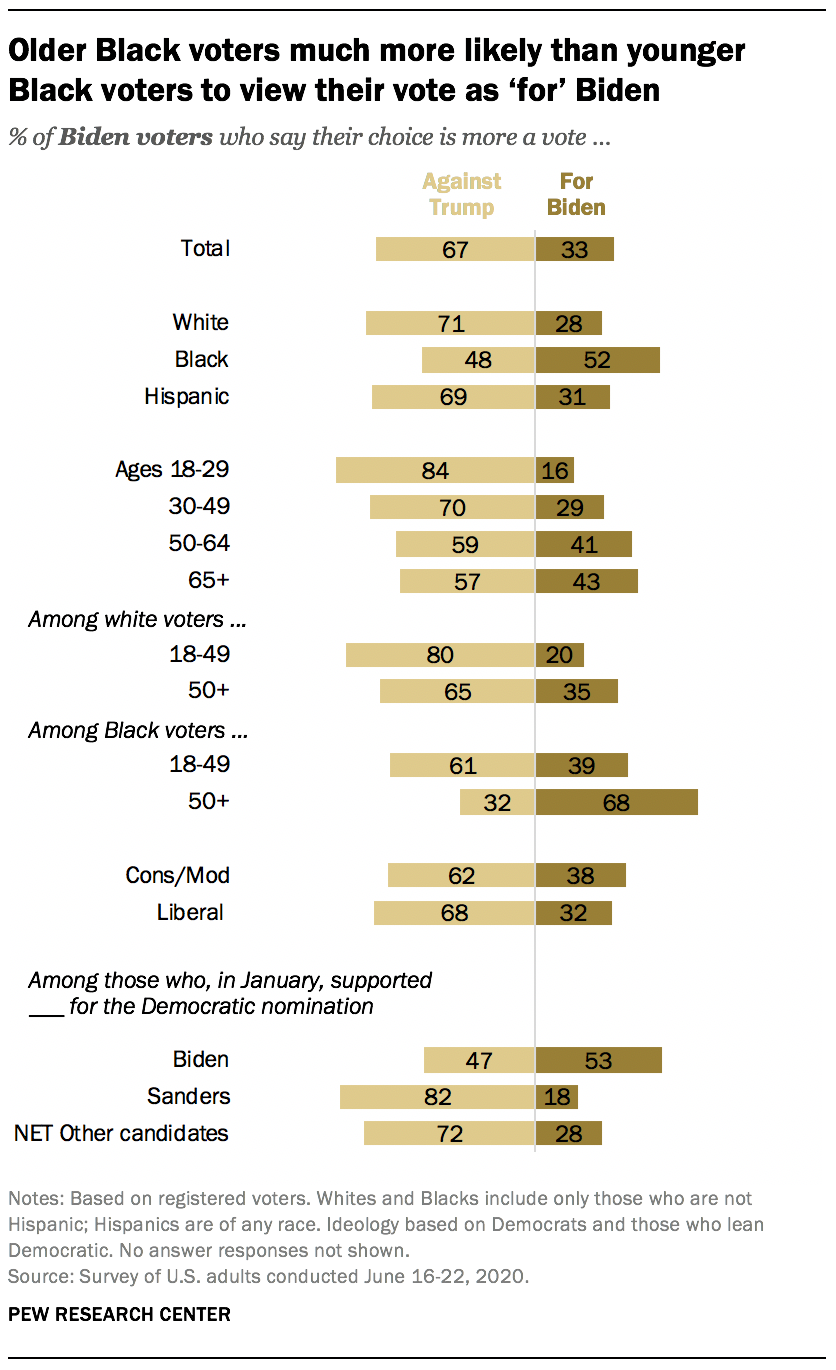
Younger Biden voters are more likely to say their choice is a vote against Trump. An overwhelming majority of those ages 18 to 29 (84%) say their vote is against Trump, while just 16% say it is more a vote for Biden. Among Biden supporters ages 50 and older, a narrower majority (58%) say their vote is more a vote against Trump.
While large shares of white and Hispanic Biden voters say their vote is more against Trump (71% and 69% respectively), Black voters who support Biden are divided on whether their vote is more for Biden (52%) or against Trump (48%).
The age differences in positive support for Biden are particularly stark among Black voters who support him. Among Black voters ages 50 and older, 68% say their vote is more for Biden; among those younger than 50, just 39% say the same.
About half of Biden general election supporters who also said in January that he was their first choice in the Democratic primary say they consider their vote to be more of a vote for Biden, while roughly as many consider their vote to mainly be a vote against Trump (53% vs. 47%, respectively). Among those who said their first choice was either Bernie Sanders or another candidate, large majorities say their vote is more of a vote against Trump.
More voters have negative than positive views of Trump as president and Biden as a possible president
Voters’ perceptions of Trump as president – and Biden as a possible president – differ substantially. And while voters generally hold positive feelings about their own preferred candidate, supporters of Donald Trump have more positive views of Trump’s presidency than Biden supporters have of his potential presidency.
Among all registered voters, larger shares say that if Biden wins in November, he would be a poor or terrible president (43%) than a good or great president (28%); 29% expect him to be an average president. Evaluations of Trump’s presidency also are more negative than positive: 53% say he is poor or terrible, while 37% view him as a good or great president. Just 9% say Trump is an average president.
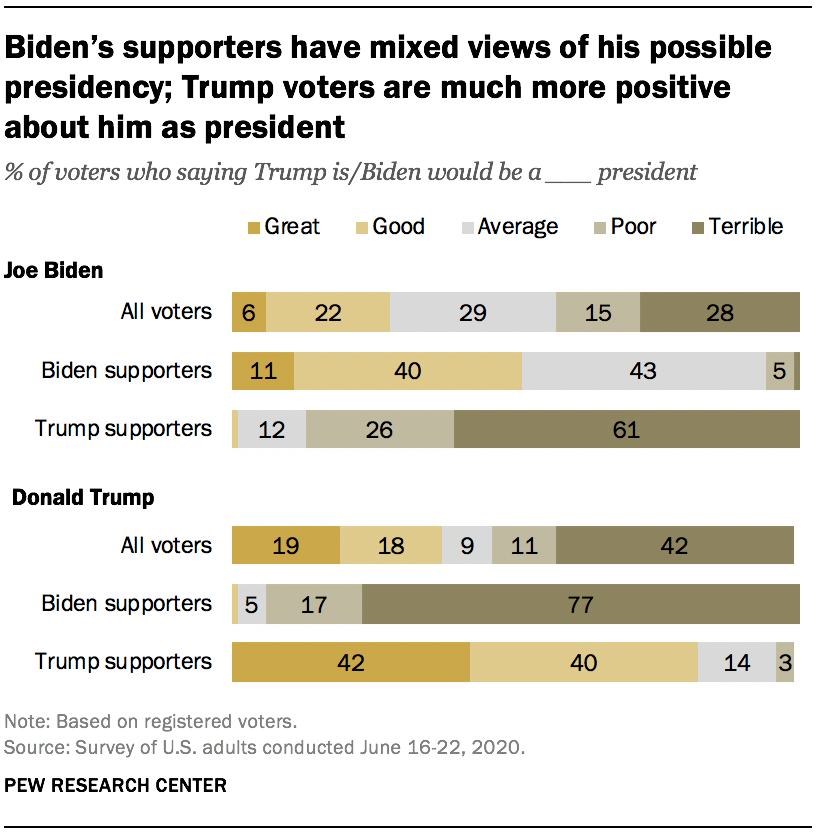
Registered voters who support Biden express mixed views about how he would be as president. About half say that, if elected, he would be a great (11%) or good (40%) president. About four-in-ten Biden voters (43%) say he would be an average president. Just 7% say he would be a poor or terrible president.
Voters who support Trump are much more positive about his presidency. About eight-in-ten say he is a great (42%) or good (40%) president. While 14% view Trump as an average president, just 4% of Trump voters say he is a poor or terrible president.
And while Biden supporters have more mixed views of their own candidate, their views of Trump’s presidency are more united and intensely negative. About nine-in-ten Biden voters (93%) have negative assessments of Trump as president, with 77% saying he is a terrible president.
Similarly, nearly nine-in-ten Trump supporters (87%) have negative views of Biden’s potential presidency, but their views are less intense: 61% of these voters say Biden would be a terrible president and 25% say he would be poor.
More voters describe Biden as even-tempered, empathetic, a good role model and honest
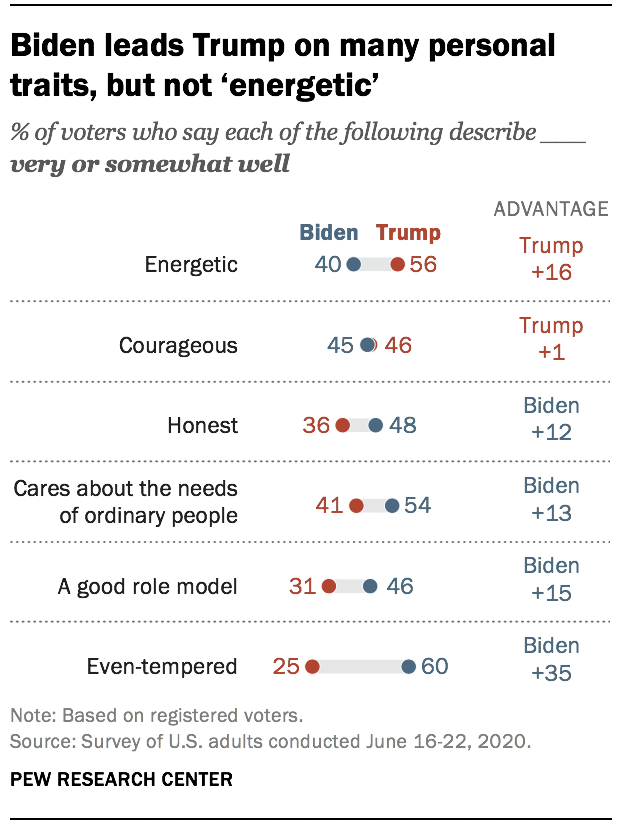
Biden has sizable advantages over Trump on several personal traits and characteristics, especially in views of the candidates’ temperaments: 60% of registered voters say the phrase “even-tempered” describes Biden very or somewhat well, while just 25% say this description applies to Trump.
More voters also say the phrase “a good role model” describes Biden (46%) than Trump (31%). And more say Biden than Trump cares about the needs of ordinary people (54% to 41%) and is honest (48% to 36%).
Roughly the same shares of voters view Biden (45%) and Trump (46%) as courageous. And Trump is more widely viewed as energetic than is Biden; 56% say Trump is energetic, compared with 40% who say this describe Biden.
While Trump and Biden supporters generally see their candidates in a positive light, they make distinctions about whether specific descriptions apply. Notably, an overwhelming share of registered voters who back Biden (84%) say the phrase even-tempered describes Biden, which is among the positive evaluations of the candidate among his supporters.
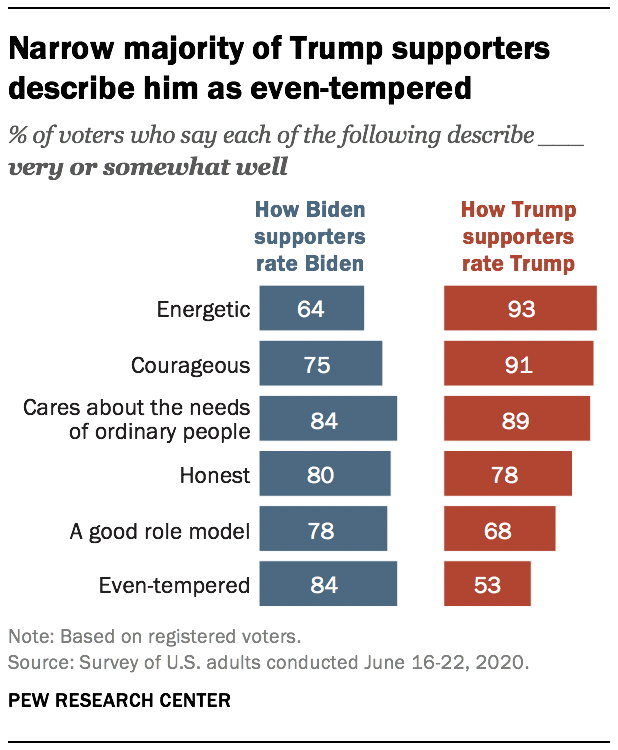
But only about half of Trump supporters (53%) describe him as even-tempered, by far the lowest share saying that about Trump of any of the six traits included in the survey.
The reverse is true when it comes to perceptions of the candidates as energetic. More than nine-in-ten Trump voters (93%) describe him as energetic; a much smaller majority of Biden supporters (64%) say this describes Biden very or somewhat well.
There also is a significant difference in views of whether Trump and Biden are courageous. While 91% of voters who support Trump describe their candidate as courageous, fewer Biden supporters (75%) say the same about him.
Large majorities of Trump and Biden supporters view their preferred candidates as empathetic and honest. But Biden supporters are 10 percentage points more likely than Trump supporters to say the phrase “a good role model” describes their candidate (78% of Biden supporters, 68% of Trump supporters).
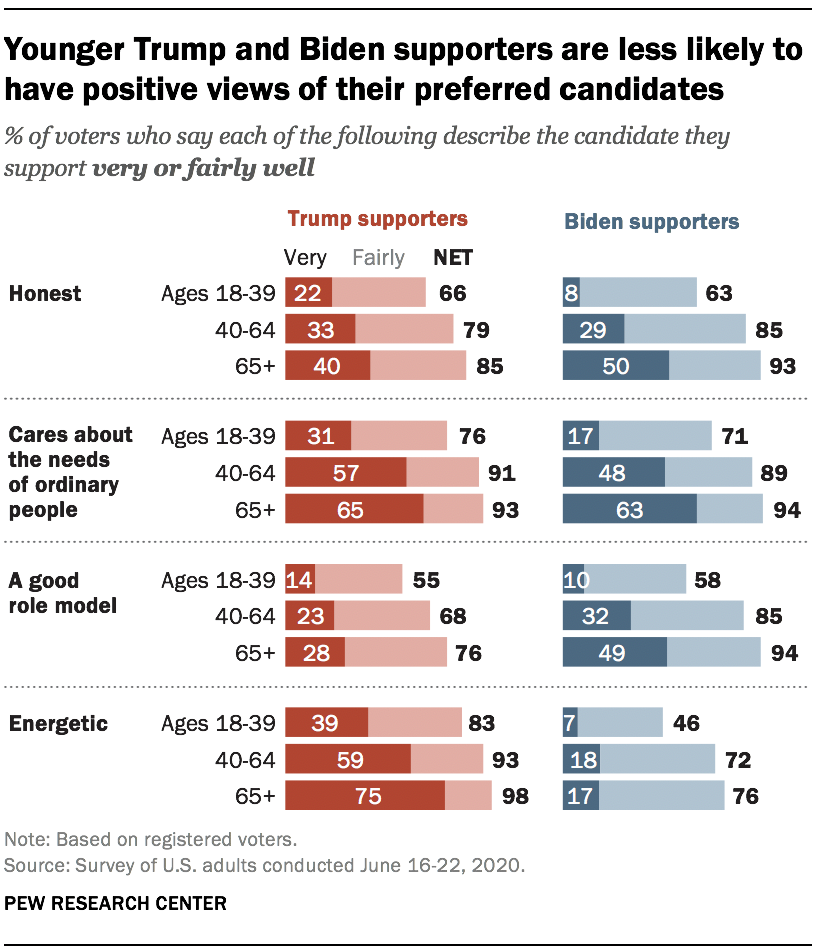
Younger supporters of both Trump and Biden are less likely to ascribe positive traits to their choice candidates than older supporters in their cohorts.
For example, while 71% of Trump voters ages 40 and older describe Trump as a good role model, a much smaller majority of those under age 40 describe him this way. There also are wide age differences among Trump supporters in perceptions of Trump as honest and that he cares about ordinary people, with fewer younger Trump supporters saying these descriptions apply.
A similar pattern is seen among voters who support Biden, particularly when it comes to views of him as energetic. More than seven-in-ten Biden supporters (73%) over 40 describe Biden as energetic, compared with 46% of those younger than 40.
Voters more confident in Biden on several issues and on bringing country closer together
Overall, similar shares of registered voters are very or somewhat confident in Trump (51%) and Biden (48%) to make good decisions about economic policy, although voters are more likely to say they are very confident in Trump (33% vs. 13%). And about as many voters express confidence in Biden (46%) as Trump (43%) to effectively handle law enforcement and criminal justice issues.
On four of the six issues included on the survey, however, voters are more likely to say they have confidence in Biden than Trump.
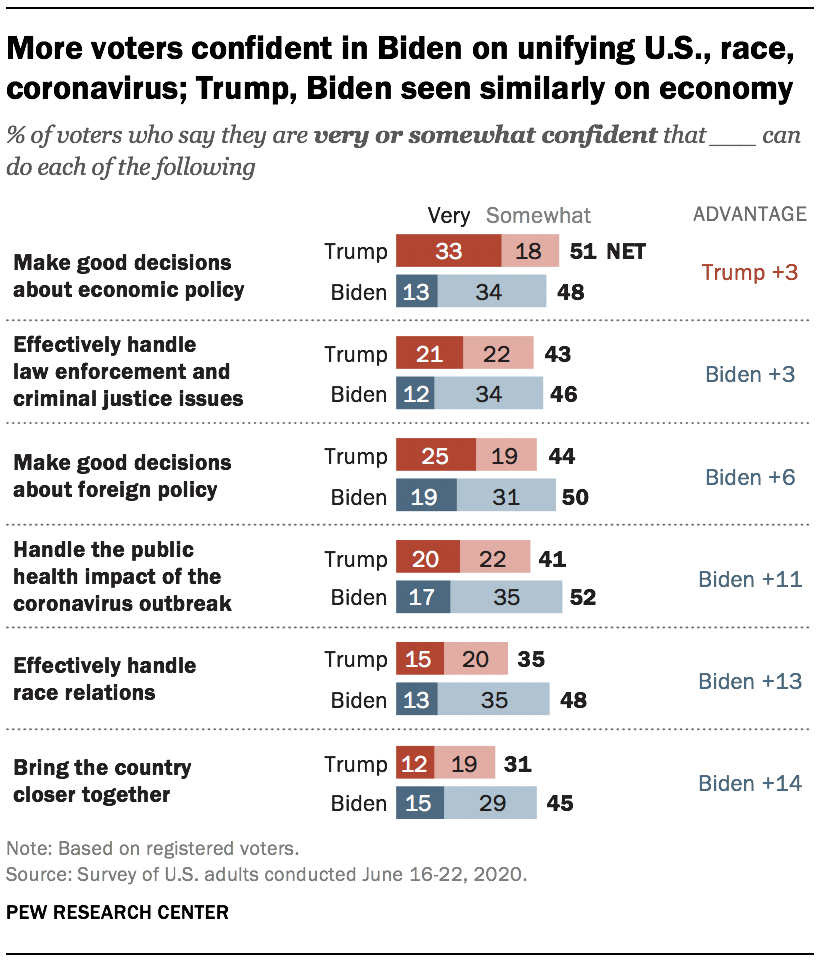
About half of voters (52%) are very or somewhat confident in Biden’s abilities to handle the public health impact of the coronavirus, while 41% say they are confident in Trump.
And more voters are confident in Biden than Trump to bring the country closer together. Still, fewer than half of voters are confident in Biden to help unify the country (45%), while just 31% are confident in Trump.
Biden also has a 13 percentage point advantage over Trump on effectively handling race relations (48% of voters have confidence in Biden, 35% in Trump).
Trump’s job approval rating declines
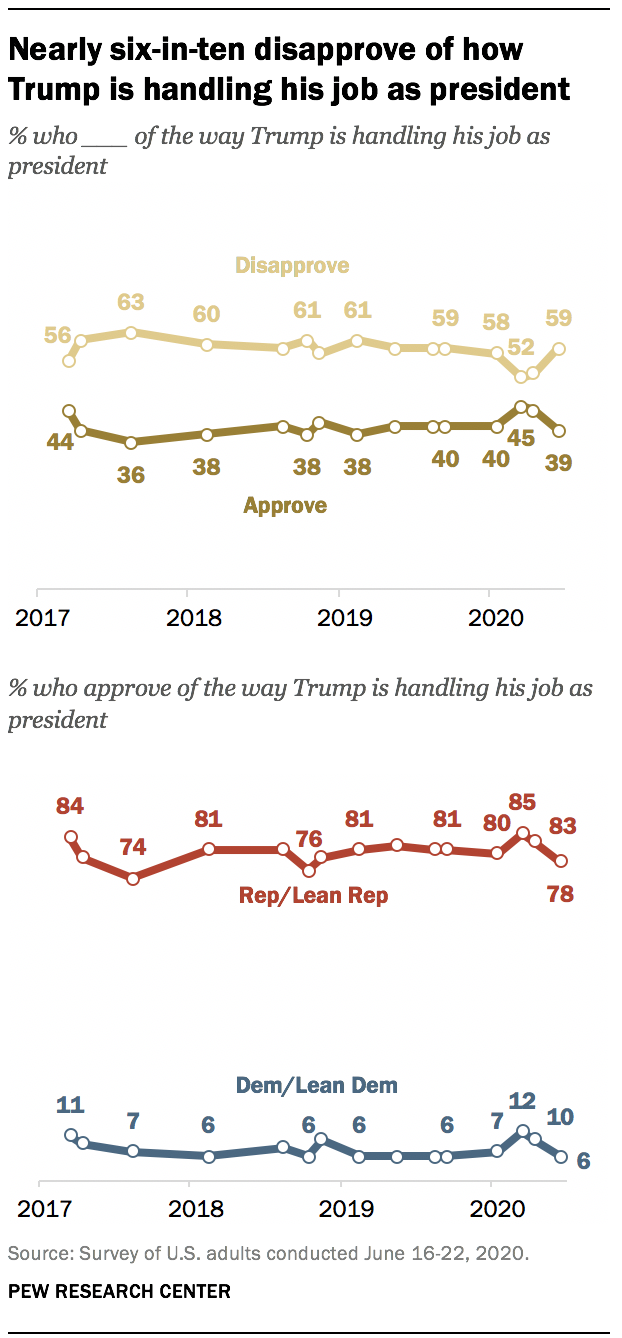
Donald Trump’s job approval rating has declined since the spring. Currently, 39% of U.S. adults say they approve of how he is handling his job as president, while 59% say they disapprove. In March and April of this year, during the early stages of the COVID-19 outbreak in the U.S., larger shares said they approved of Trump’s job performance (45% and 44%, respectively). While Trump’s job rating has declined in recent months, it has now returned to about where it had been throughout much of his presidency.
The recent decline in Trump’s job approval can be seen across most demographic and political groups. For instance, Republicans and Republican leaners are now 7 percentage points less likely to say they approve of Trump than in March (78%, vs. 85% then). Among Democrats and Democratic leaners, Trump’s approval rating is down 6 points over this period of time (from 12% in March to 6% today). The partisan gap in ratings of Trump remains as wide or wider than those seen for other previous U.S. presidents in the polling era.
There continue to be wide differences in assessments of Trump’s job performance across demographic groups.
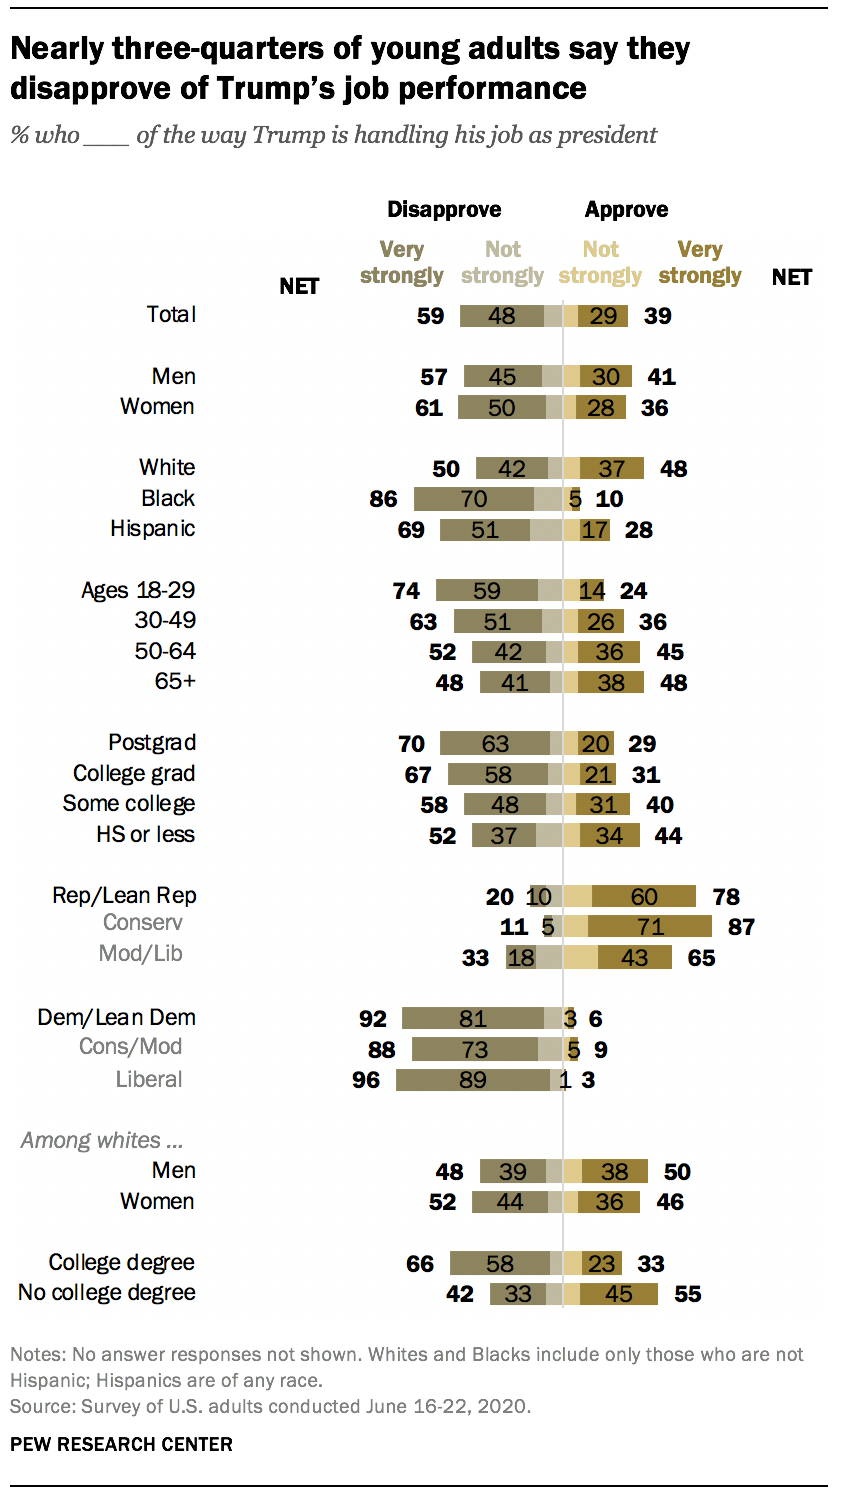
White adults are now about evenly split in their views of Trump: 48% approve of how he’s handling his job, while 50% say they disapprove. In March, Trump’s ratings among whites tilted positive (54% approved, 44% disapproved).
Roughly seven-in-ten Hispanic adults (69%) disapprove of Trump’s job performance, as does an even larger majority of Black adults (86%). Disapproval among Black adults is especially deeply held: 70% say they very strongly disapprove of his job performance; in March, 58% said this.
Younger adults remain much more critical of Trump’s performance than older adults. About three-quarters (74%) of those ages 18 to 29 disapprove of how Trump is handling his job. The oldest adults (ages 65 and older) are as likely to say they approve (48%) as disapprove (48%) of Trump. Disapproval of Trump has edged higher among all age groups since earlier this year.
Trump continues to receive positive ratings, on balance, from white adults without a college degree: 55% say they approve of Trump, while 42% disapprove. As with other groups, Trump’s ratings among whites without a college degree are more negative than they were in March, when 62% said they approved of his performance and just 36% said they disapproved.
Who has changed their views on Trump?
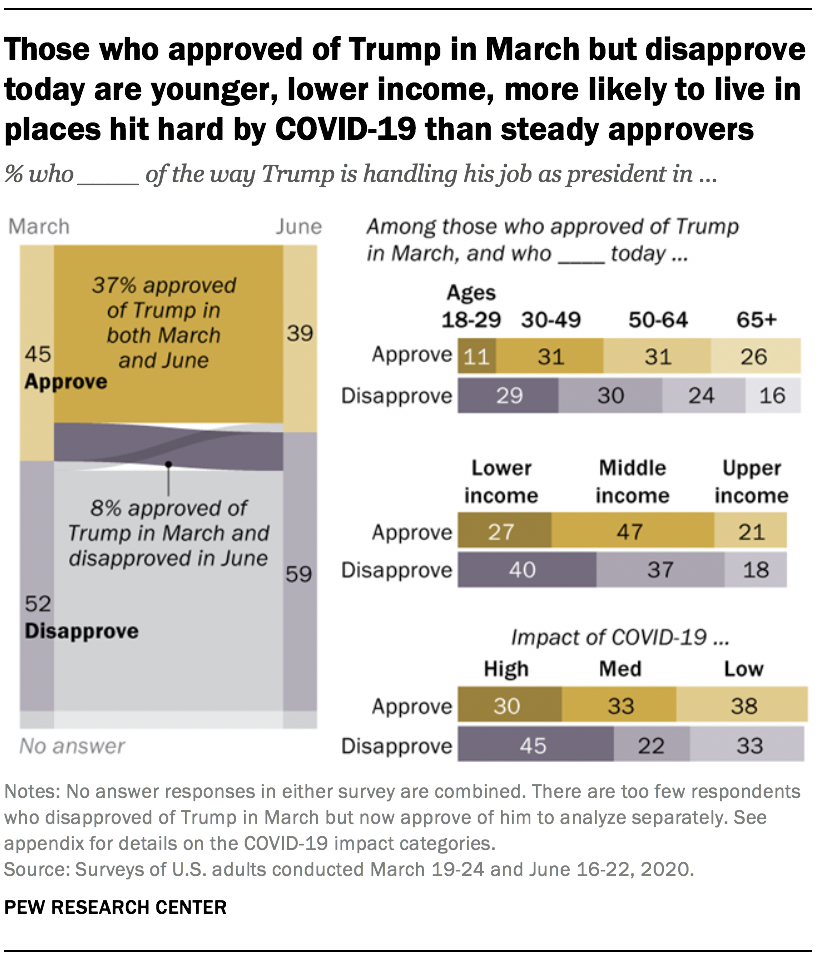
While Trump’s overall approval has slipped several points from where it stood in March, most Americans’ views of the president have remained relatively stable over the past three months. Looking at the same group of adults who were surveyed in both March and June, 17% of those who approved of Trump in March now disapprove of him (representing 8% of the public overall). They are somewhat different demographically from those who approved of the president’s performance in March and continue to do so; 81% of those who approved in March also do so today.
Compared with those who continue to approve of Trump, those who previously approved and now disapprove are younger, have lower family incomes and are more likely to live in places hardest hit by the coronavirus outbreak.
Those who approved of the president in March and now disapprove are also about evenly divided in their partisan leanings (51% are Republicans or Republican-leaning independents and 42% are Democrats or Democratic leaners). Those who approved at both points are overwhelmingly Republican or Republican-leaning (91%). There are no substantial differences in the gender or educational makeup of these two groups.
Those who formerly approved of Trump but now disapprove are about as likely as those who approved at both points to live in 2020 battleground states (see appendix for details on battleground states).
Nearly all – 95% – of those who disapproved of Trump in March continue to disapprove of him today; just 3% say they now approve.
Public critical of Trump’s impact on tone of U.S. political debate
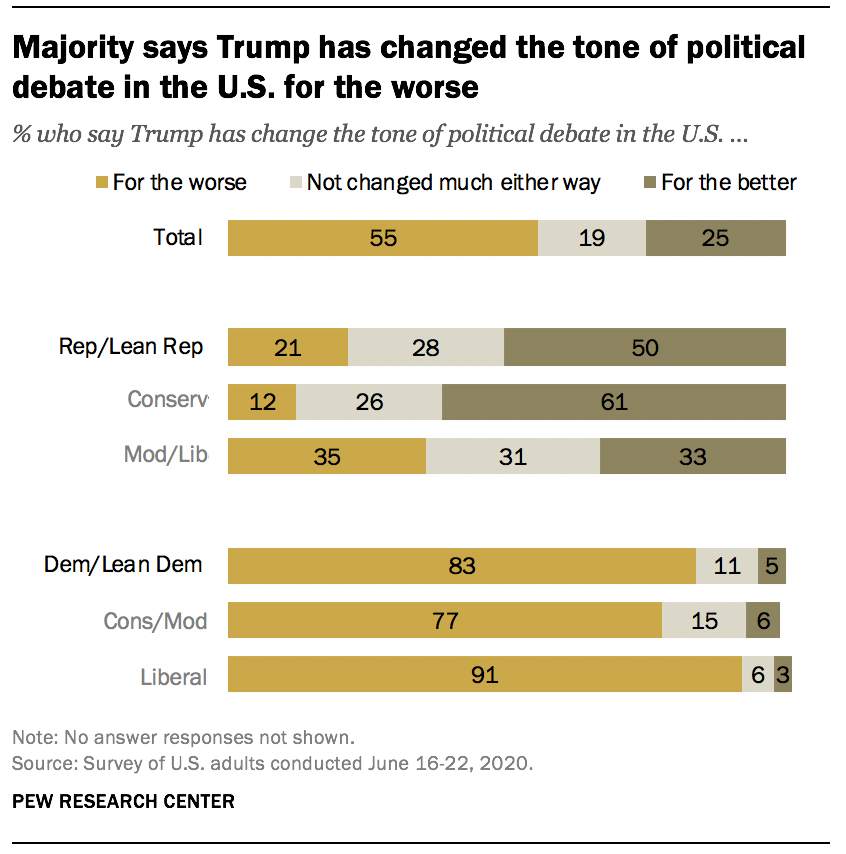
On balance, the public believes that Trump has had a negative impact on the tone and nature of political debate in the U.S. A narrow 55% majority says he’s changed the tone of debate for the worse, compared with just 25% who say he’s changed it for the better; 19% say he hasn’t changed the tone of political debate much either way. Views on this question are nearly identical to those in the spring of 2019.
A large majority of Democrats and Democratic leaners (83%) say Trump has changed the tone and nature of political debated for the worse.
Among Republicans and Republican leaners, views are more mixed. Half say he has changed the nature of political debate in the country for the better, while 28% say he hasn’t changed it much and 21% say he’s changed it for the worse. There is a significant divide in views on this question among Republicans by ideology. Far more conservative Republicans say Trump has changed U.S. political debate for the better than for the worse (61% vs. 12%). By contrast, moderate and liberal Republicans are about as likely to say he’s changed debate for the worse (35%) as for the better (33%).
Does Trump have a responsibility to release his tax returns?
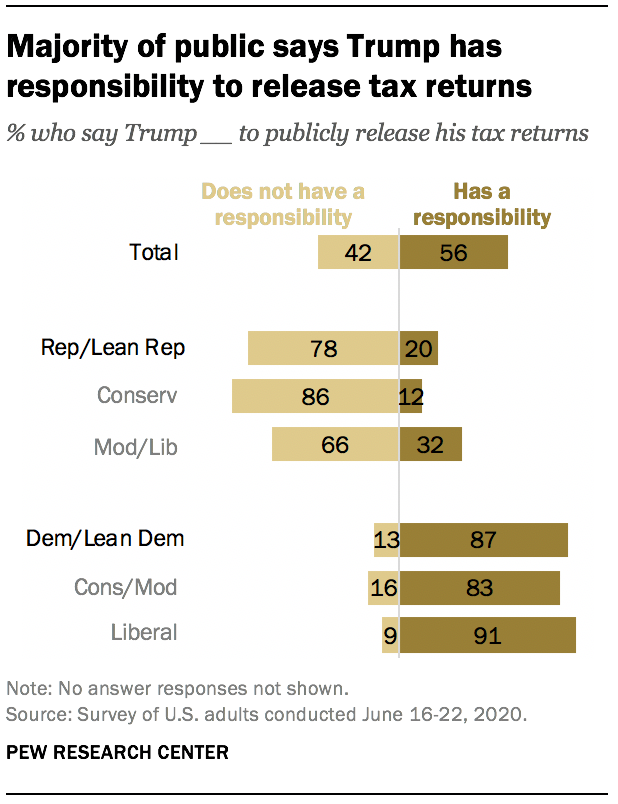
By 56% to 42%, more Americans say Trump has a responsibility to publicly release his tax returns than say he does not have this responsibility.
Partisans take opposing views on this question: 78% of Republicans and Republican leaners say Trump does not have a responsibility to release his tax returns; an even larger share of Democrats and Democratic leaners (87%) say he does have this responsibility.
Among Republicans, conservatives are 20 points more likely than moderates and liberals to say Trump does not have a responsibility to reduce his tax returns (86% vs. 66%). There is a more modest ideological gap among Democrats.
National satisfaction drops
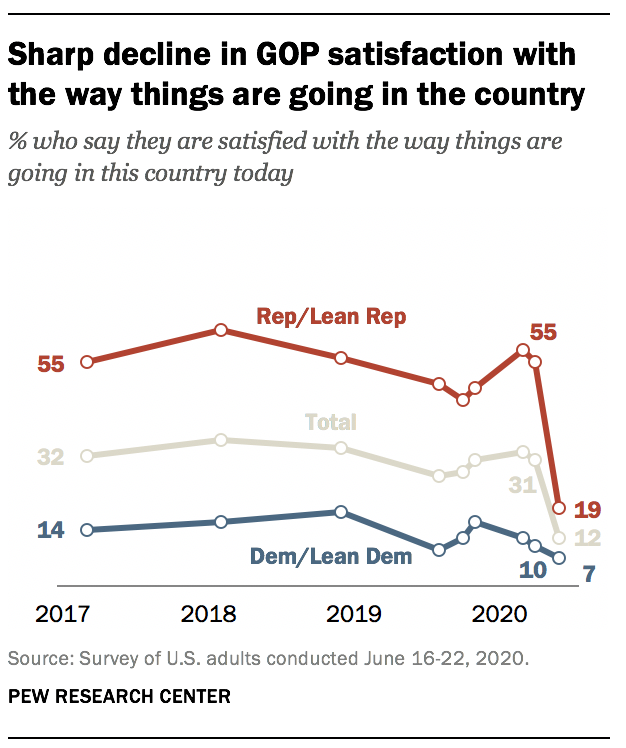
Just 12% of Americans say they are satisfied with the way things are going in this country today – a 19 percentage point decline in national satisfaction since April and lower than at any previous point in Trump’s presidency. Nearly nine-in-ten (87%) now say they are dissatisfied with the way things are going.
The partisan gap in levels of satisfaction has narrowed to just 12 percentage points, with 19% of Republicans and Republican leaners and 7% of Democrats and Democratic leaners now saying they are satisfied with the way things are going. Until today, GOP satisfaction had been above 50% for nearly all of Trump’s presidency – including 55% of Republicans reporting they were satisfied with the way things were going as recently as April. While Democratic satisfaction is also lower than it was two months ago, this reflects a more modest decline (from 10% to 7%).
Most Americans feel anger, fear about the state of the nation
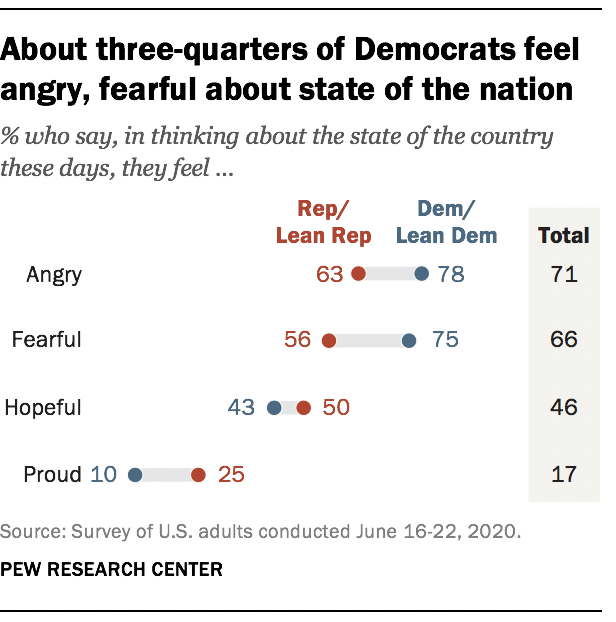
About seven-in-ten Americans (71%) say they feel angry about the state of the country these days, while roughly two-thirds (66%) say they feel fearful. While majorities in both parties say this, these views are more widespread among Democrats than Republicans. Nearly eight-in-ten Democrats (78%) report feeling angry about the state of the nation; 63% of Republicans say the same. And while 75% of Democrats say they feel fearful thinking about the state of the country these days, a narrower majority of Republicans (56%) say this.
Far smaller shares of Americans report feeling hopeful or proud thinking about current national conditions – 46% say they feel hopeful, while just 17% report feeling proud.
Republicans are modestly more likely than Democrats to say they are hopeful (50% vs. 43%). Only a quarter of Republicans report feeling proud thinking about the country these days. Still, that is substantially higher than the share of Democrats saying this (10%).
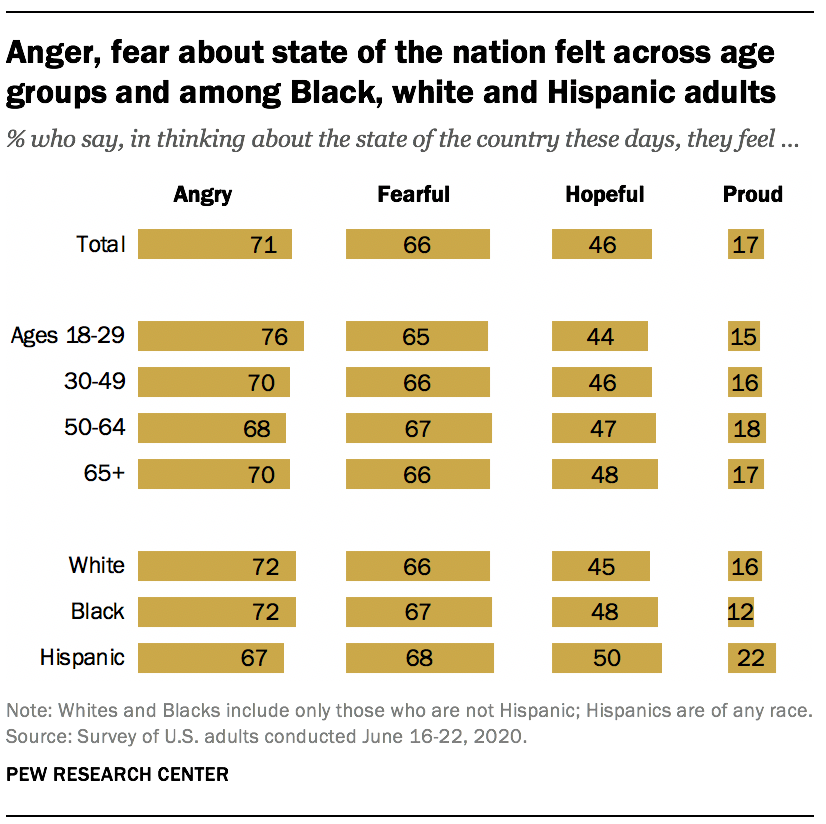
There are only minor demographic differences in reported emotional reactions about the state of the country. Two-thirds or more across all age groups say they are angry about the state of the nation, with those ages 18 to 29 modestly more likely than older groups to say this (76% report feeling angry). And roughly two-thirds across age groups say they are fearful about the state of the country these days. There are similarly no significant age differences in the shares saying they are hopeful or proud.
About two-thirds of white (66%), Black (67%) and Hispanic (68%) adults each say they feel fearful about the state of the country. Identical shares of white and Black adults say they feel angry (72% each), while roughly as many Hispanic adults (67%) say this.
Views about prospects for future generations improve among Black and Hispanic Americans
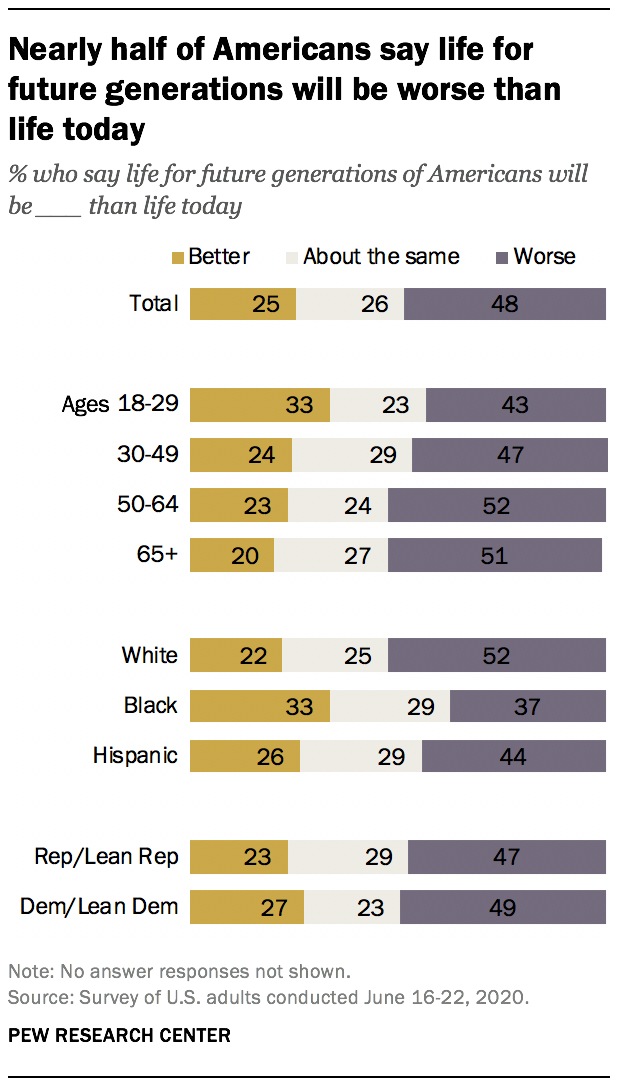
About half of the public (48%) says life for future generations of Americans will be worse than life today, while a quarter (25%) say it will be better and a similar share (26%) say it will be about the same. Within nearly all major demographic and political groups, more say life will be worse for future generations than say it will be better.
Younger adults are somewhat more likely than older adults to say life will be better for future generations. A third of those ages 18 to 29 say this, compared with about a quarter of those ages 30 to 49 (24%) and 50 to 64 (23%) and 20% of adults 65 and older.
A third of Black Americans (33%) say life will be better for future generations, while a smaller share of white Americans (22%) say this. About a quarter of Hispanic Americans (26%) say life will be better for future generations.
There are only modest partisan differences on this question, though Democrats are slightly more optimistic (27% say life for future generations of Americans will be better, as do 23% of Republicans).
However, Democrats have become more optimistic about how life will be for future generations of Americans since the question was last asked last fall, while Republicans have become less optimistic. In September, just 14% of Democrats said life would be better for future generations; today, roughly double that share say this (27%). In contrast, the proportion of Republicans saying life would be better decreased from 31% to 23% over the same period.
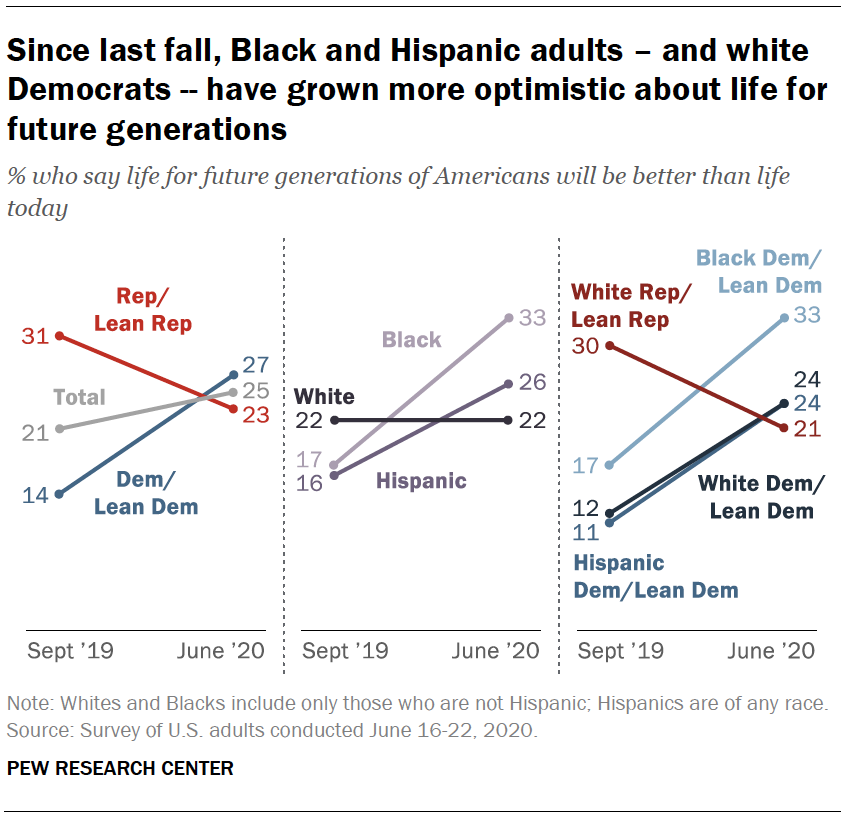
The share of white Americans saying life will be better for future generations has not changed since the fall (22% then and now). However, the shares of Black and Hispanic Americans expressing optimism for life for future generations have increased substantially, from 16% to 26% among Hispanic adults and nearly doubling – from 17% to 33% – among Black adults.
While white Americans’ opinion on this question is little changed overall, the views of white Democrats and white Republicans have moved in opposite directions. The share of white Democrats who say life will be better for future generations doubled from 12% in September to 24%. The share of white Republicans saying life will be better has decreased from 30% to 21%.