The financial concerns of people who are relatively well-off have been increasing in recent months. But the fallout from the financial crisis – in struggles to pay for housing and health insurance, problems with credit, as well as in job layoffs and pay cuts –continues to be felt most acutely by lower-income Americans.

Overall, 23% say they have had trouble getting or paying for health care for themselves or their family in the past year. One-in-five (20%) say they had trouble paying their rent or mortgage; an identical percentage (20%) says they had problems with collection or credit card agencies. Comparable proportions say they have been laid off or lost their job (18%), had a mortgage or credit application denied (17%). In addition to those who say they have been laid off, another 11% say they had their hours or pay reduced.
There have been modest increases since January 2008 in the percentage saying they have been laid off or lost their job (18% now vs. 14% then), and in the proportion saying they have had problems paying for their rent or mortgage (20% vs. 14%).

All of these financial problems are much more prevalent among those with lower incomes than those with higher incomes. Among those with annual family incomes of less than $30,000, 38% have had trouble getting or paying for medical care, compared with 20% of those with family incomes of between $30,000 to $75,000, and 11% of those with incomes of at least $75,000. There is a similar pattern in experiences with other financial problems.
Overall, nearly two-thirds (65%) of those with annual family incomes of less than $30,000 have experienced at least one of these five economic struggles over the past year. That compares with 43% of those with incomes of between $30,000 and $75,000, and 26% with incomes of $75,000 or more.
Consumer Cutbacks Widespread
The vast majority of Americans (86%) report having made reductions in spending or changes in their saving or investment patterns lately. This includes 59% who have cut back on planned spending for vacation travel; 55% who have been eating out at restaurants less often; and 53% who have changed the way their money is saved or invested. Other spending cutbacks include 44% who have delayed or canceled plans to make a major purchase for their household, such as a computer or appliance; 37% who have delayed or canceled plans to buy a new home or make major home improvements; 37% who have delayed or canceled plans to buy a new car; and 29% who have adjusted their plans for retirement. These figures are largely unchanged since December.

People of all incomes report having changed their spending and saving patterns recently – 87% of Americans with family incomes of $75,000 or more have done so, as have 86% of those with incomes of less

than $30,000, and 88% of those falling in between. But the specific cutbacks and adjustments differ across income groups. In general, lower-income Americans are the most likely to have cut back on vacations, or to have delayed home improvements or buying a home, car, or major household item. Higher-income Americans are the most likely to have made adjustments to their retirement plans.
For most Americans, cutbacks in consumer spending continue to be driven more by worries about the possibility of future financial problems rather than by actual financial hardships. Just 30% say reductions in spending on dining out, vacations, cars or home items have been necessary due to their financial situation having gotten worse. Instead, 56% say they have made these kinds of cutbacks because they worry that their financial situation might get worse in the future. These figures are virtually unchanged since December and suggest that the psychological impact of bad times, rather than an actual decline in people’s financial conditions, continues to be the principal driver of consumer cutbacks.
Fewer Report Getting Raises

While more people say they have been laid off than did so at the beginning of last year, there has been an even bigger decline in the proportion saying they have gotten a pay raise or obtained a better job. In the current survey, 29% say they have gotten a raise or a better job in the past year, down 12 points from January 2008.
Among those who are employed, either full-time or part-time, 45% say they have gotten a raise or a better job, compared with 56% in January 2008. As might be expected, more full-time workers than part-time workers say they have gotten a raise or a better job in the past year (51% vs. 30%).
More than half (58%) of employees in large organizations (100 or more employees) have gotten a raise over the past year, while this is true for only 30% of those working in smaller organizations. A majority of government workers (55%) say t hey have gotten a raise or a better job in the past year, as do 50% of those who work for private companies.
Taking a Pay Cut

In addition to those who say they have been laid off in the past year, 17% of workers have had their hours reduced or been asked to take a cut in pay. More of those with a high school education or less (19%) say they have had a pay cut in the past year, compared with 12% of college graduates. College graduates also are less likely to have been laid off in the past 12 months (6% vs. 15% of those with no more than a high school education).
More than a quarter (26%) of part-time employees had their hours or pay reduced this past year compared with 13% of full-time employees. Only 9% of salaried workers have had their hours reduced or pay compared with 22% of hourly workers. More part-time and hourly workers also say they have been laid off or lost their jobs.
Nearly twice as many employees of private companies or businesses than government workers have had their hours or pay reduced (20% vs. 11%). There are no differences by employer size.
More See Pay Cuts Coming

Many workers see increasing job difficulties ahead. While 16% say that they have had a pay cut or their hours reduced in the past 12 months, somewhat more (25%) say that it is at least somewhat likely they will be asked to take a cut in pay during the next 12 months. Notably, just 13% of workers thought this was likely in January 2008.
Nearly a quarter of workers (24%) say it is likely their health care benefits may be reduced or eliminated, compared with 20% last year. And 18% now say it is at least somewhat likely that their retirement benefits may be reduced or eliminated.
The proportion of workers who say it is very or somewhat likely they may be laid off from their job has increased from 15% to 21% since January 2008. While most (77%) say it is unlikely they will be laid off, only 46% see the prospect of layoff as not at all likely. And 13% say it is likely their employer may go out of business or relocate, which is little changed from last year.

Job concerns have risen sharply among those with higher incomes since January 2008. A quarter of all Americans, regardless of income, now say it is very or somewhat likely they may be asked to take a cut in pay in the next 12 months. Among those with family incomes of $75,000 or more, the proportion saying it is likely they may take a cut in pay has nearly tripled, from 9% in January 2008 to 24% currently. Similarly, over the same period, concern about pay cuts has nearly doubled among those with family incomes of between $30,000 and $75,000, from 12% to 23%. There has been little change in concern about pay cuts for those earning less than $30,000 (26% now vs. 23% in January 2008).
More than a quarter of workers with family incomes of $75,000 or more (27%) and a comparable percentage of those making between $30,000 and $75,000 (28%) say it is at least somewhat likely that their health care benefits will be reduced or eliminated. By contrast, fewer workers with incomes of less than $30,000 see a reduction or elimination of health benefits as likely (16%).
While a relatively small minority of workers with family incomes of $75,000 or more say it is very or somewhat likely they may be laid off (15%), the percentage has nearly doubled – from 8% – since January 2008. Similarly, 29% of those with household incomes of $30,000 to $75,000 now see a layoff as likely, compared with just 15% in January 2008. The proportion of workers with incomes of less than $30,000 who see a layoff as likely has not increased (19% today vs. 23% in January 2008).
Concern Grows Among Older, Educated Workers
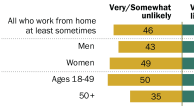
When looking at those who have expressed at least one of the four job concerns asked in January 2008 and the current poll, the majority says it is not likely they will experience a job stress in the next 12 months. However, 44% say it is very or somewhat likely that they may be laid off, asked to take a cut in pay, their health care benefits may be reduced or eliminated or that their employer may go out of business or relocate; this is up significantly from 35% last year.

Increased concern among those with higher incomes has driven this change. The sharp income differences in January of last year have now virtually disappeared as more than four-in-ten across all income groups say it is likely that at least one of the job stresses will happen to them in the next year. Among those with incomes of $75,000 or more, about a quarter (27%) expressed concern that they would experience a job stress in January 2008; this has risen by 16 points in the current poll. Similarly, concern has risen among those with incomes between $30,000 and $75,000 from 35% last year to 47% currently. There has been little change among those earning less than $30,000.
Similarly, there are now no significant differences in education as concern among college graduates has also risen; 46% of college graduates say it is likely that they will experience at least one job stress in the next 12 months, up 18 points from last year. Job concerns among those with some college education are also up slightly from 33% last year to 42%.
The youngest employees are experiencing the least amount of concern about their jobs; a third of those under 30 say it is likely that they will experience at least one job stress while about half of those 30 and older express some concern. Compared with January of last year, concern about job stresses is up 13 points among those aged 30 to 49 and 11 points for those aged 50 to 64.
Views of Employer Finances Decline Too

Workers’ perceptions of the fiscal health of their employers have declined considerably over the course of the year. While a majority of working Americans (58%) continues to say that their employer is in “excellent” or “good” financial shape, 39% now describe the financial condition of the company or organization that employs them as “only fair” or “poor,” up 12 percentage points from a year ago. In particular, the proportion assessing their employer’s condition as “excellent” is down sharply; today, only 15% of workers say this, compared with 30% last February.

In February 2008, three-quarters of college graduates characterized their employer’s financial condition as excellent or good; today, just a slim majority (52%) views their employer’s financial condition positively. By comparison, among those without college degrees, opinions have changed little since last year.
Views of the financial health of employers among workers in the Midwest and the Northeast also are more negative today than they were a year ago. Half of workers in the Northeast give their employers excellent or good bills of fiscal health, down from 70% in February 2008; a similar decline is seen among those in the Midwest (from 72% last year to 56% today). By contrast, workers in the South and West offer about the same assessments of their employers’ financial conditions as they did last February.

Those working in government (federal, state or local, and including public education), are more negative in their assessments of the financial health of their employer than are those who work for private companies or businesses. Only 46% of gov ernment employees characterize the financial condition of their employer as excellent or good; by contrast, 63% of those in the private sector give positive assessments. There is also widespread concern among those who are self-employed or business owners – half say their company is in excellent or good shape, but nearly as many (48%) say they are in only fair or poor shape.