
To gauge the accuracy of estimates from the RDD and RBS samples on nonpolitical topics, the surveys included a number of questions that are also measured in high-quality federal surveys with high response rates.10 This study measures accuracy by looking at how closely the weighted RDD and RBS telephone survey estimates match up with 15 benchmarks for the U.S. adult population from the federal surveys. The benchmarks cover a range of respondent characteristics, attitudes and behaviors such as health insurance coverage, smoking, use of food stamps, employment status and sleep habits.
Overall, estimates from the RBS survey were very similar to those from the RDD survey. The mean absolute difference from government benchmarks was 3.3 for the RBS and 3.9 percentage points for the RDD surveys.11 None of the RBS estimates was significantly different from the RDD estimates on the benchmark items.
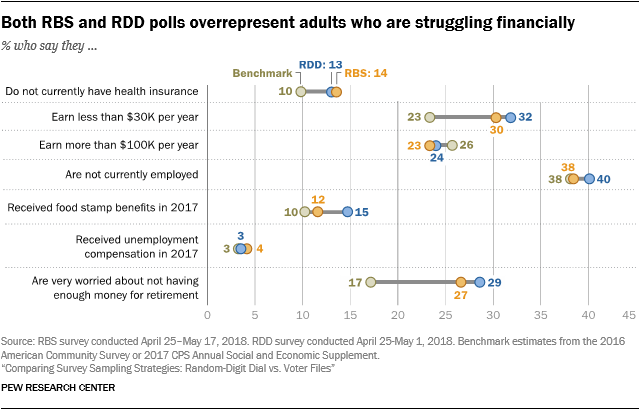
When the RBS and RDD estimates departed from the benchmarks, they tended to overrepresent adults who are struggling financially. According to the American Community Survey, about one-in-ten U.S. adults (10%) do not have health insurance, but this rate was 13% in the RDD survey and 14% in the RBS. Similarly, 30% of RBS respondents and 32% of RDD respondents reported an annual family income less than $30,000. The benchmark from the American Community Survey, a high response rate survey conducted by the Census Bureau, is 23%. And compared with a government survey, many more telephone survey respondents (in both samples) said they were “very worried” about not having enough money for retirement.
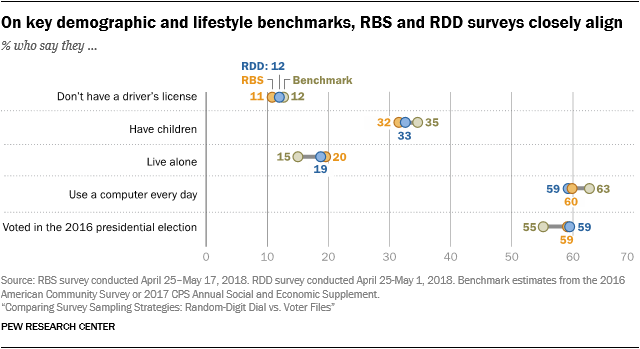
There were also a few discernable departures from population benchmarks on a mix of lifestyle items. Both the RDD and RBS surveys overrepresented adults who live alone, average less than seven hours of sleep per night, and have practiced yoga at least once in the past 12 months.
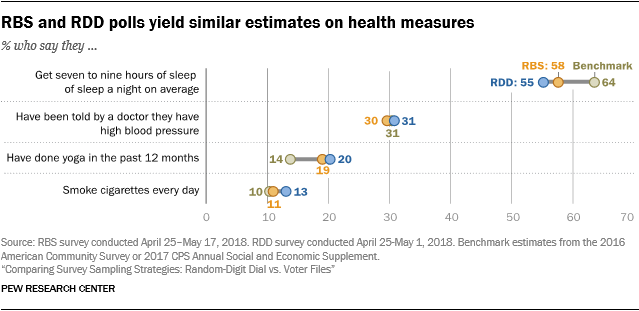
But on about half (seven) of the 15 benchmarks, the RDD and RBS surveys both captured the benchmark value within the telephone surveys’ margin of error. For example, both surveys were highly accurate on the share of American receiving unemployment benefits, the share not employed and the share diagnosed with high blood pressure.
The study also found highly similar levels of accuracy from the RBS and RDD surveys for subgroup estimates. For example, RDD and RBS estimates for Hispanic adults diverged from Hispanic benchmarks by an average of 4.8 and 4.7 percentage points, respectively, across the measures examined. RDD and RBS estimates for non-Hispanic blacks diverged from benchmarks by 5.6 and 6.3 percentage points, respectively. Indeed, the clearest finding from this analysis is that the RDD and RBS surveys produced highly similar estimates on these 15 questions with reliable, known population values.
Registered voter estimates from RDD and RBS show similar levels of accuracy
The study also compared the accuracy from the RDD versus RBS surveys for estimates based on registered voters (RVs). There are fewer benchmark variables available for this analysis than for the analysis above looking at estimates for all adults. That’s because the source of benchmarks for RVs is the Current Population Survey (CPS) Voting and Registration Supplement, which does not ask about topics such as computer usage, concern about saving for retirement, or smoking.
On the five questions where RV benchmarks are available, the study finds very similar levels of accuracy for the RDD and RBS surveys. Both surveys come within 3 or 4 percentage points of the RV benchmark for employment but underrepresent those with children and overrepresent those living alone.
As with the benchmarks for the entire adult population, this RV analysis suggests that both the RBS and RDD surveys slightly overrepresent adults struggling financially. For example, the CPS benchmark shows that one-in-five RVs (21%) have annual family income under $30,000, but in both the RDD and RBS surveys that share was one-quarter (25%).

Caveats about benchmarks
Assessing bias in surveys requires an objective standard to which the findings can be compared. In election polling, this standard is the outcome of the election – at least for measures of voting intention. Administrative records, such as the number of licensed drivers, can provide others. But most benchmarks are taken from other surveys. Aside from the number of licensed drivers, the benchmarks used here are drawn from large government surveys conducted at considerable expense and with great attention to survey quality. But they are nevertheless surveys and are subject to some of the same problems that face surveys like the two telephone surveys examined here.
Government surveys tend to have very high response rates compared with surveys with opinion polls conducted by commercial vendors or nonprofit organizations like Pew Research Center. Accordingly, the risk of nonresponse bias is generally thought to be lower for these government surveys, though it still exists. More relevant is the fact that all surveys, no matter the response rate, are subject to measurement error. Questions asked on government surveys are carefully developed and tested, but they are not immune to some of the factors that create problems of reliability and validity in all surveys. The context in which a question is asked – and the questions that come before it – often affects responses to it. Given that this study selects benchmarks from more than a dozen different government surveys, it is impossible to re-create the exact context in which each of the questions was asked. Similarly, all survey items may be subject to some degree of response bias, most notably “social desirability bias.” Especially when an interviewer is present, respondents may sometimes modify their responses to present themselves in a more favorable light (e.g., by overstating their frequency of voting). All of these factors can affect the comparability of seemingly identical measures asked on different surveys, though government surveys may be affected by the same forces.
One other issue is that benchmarks are generally unavailable for questions about attitudes and behaviors that the government does not study. As a result, this analysis uses benchmarks for only a subset of the questions asked on the survey. Moreover, Pew Research Center’s work – and the work of other polling organizations conducting political and social research – tends to focus on subjects and questions other than the ones for which benchmarks are available.
CORRECTION (April 2021): A previous version of this report incorrectly stated the mean absolute difference between the RDD sample estimates and government benchmarks. None of the study’s findings or conclusions are affected.
