
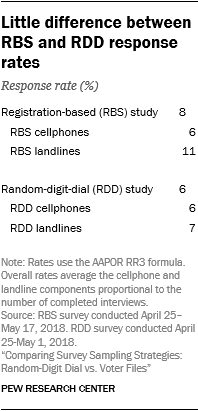
One of the claimed advantages of RBS surveys is their efficiency. Unlike RDD surveys, which rely on lists of potentially working telephone numbers, RBS surveys use lists of actual Americans. Despite these structural differences, this study found little advantage for the RBS sample in terms of efficiency. The overall response rate was 8% for the RBS survey versus 6% for the RDD survey.
What’s more, at least one design decision led the RBS response rate in this study to be higher than what is typically seen in practice. When pollsters conduct RBS surveys, they often find it cost-prohibitive to require that the person they interview match the name of the voter file record sampled for the survey. We required that matching for this study, though only for landline cases. Discussions with the survey vendor and with other pollsters suggested that the match rate would be too low when calling cellphone numbers to attempt matching.
If there had been no matching requirement in this study, the response rate for RBS landline cases is projected to have been approximately 4% (rather than the observed 11%), pushing the overall RBS response rate down to a projected 5% (rather than the observed 8%).12
A look at the cellphones dialed in the RBS and RDD surveys provides a more apple-to-apples comparison. In both surveys, when calling a cellphone number, interviewers attempted to complete the survey with whomever answered the phone provided that the person was age 18 or older. The cellphone response rate was 6% in both surveys.
Stepping outside the RBS comparison for a moment, the response rate to the RDD survey is noteworthy on its own. The last Pew Research Center study to drill deep into RDD data quality found that, in 2016, the average response rate to the Center’s RDD surveys was 9%. The RDD response rate in this study was 6%. While the rate fluctuates from survey to survey, the 6% found here is indicative of a general decrease in RDD response rates over the last two years. Identifying the causes of that decline is beyond the scope of this study, though there have been multiple reports about the recent increase in telemarketing to cellphones and the effects of technology designed to combat it.
Characteristics of the raw, unweighted samples
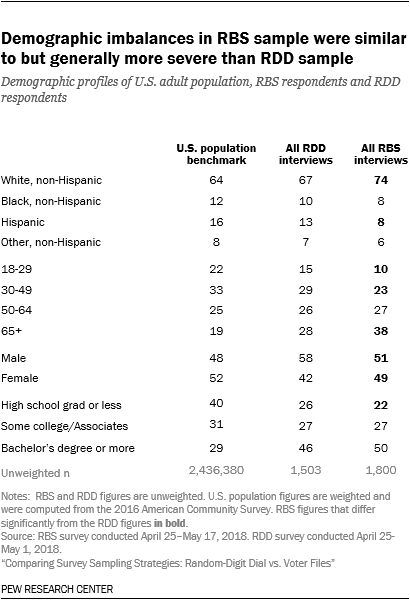
When no statistical weighting is applied to the data, shortcomings of the RBS sample come into view. The RBS sample produced a larger share of non-Hispanic whites (75% vs. 67% for the RDD sample; Non-Hispanic whites are 64% of the population) and obtained substantially fewer Hispanics: 8% in the RBS sample vs. 13% in the RDD sample. The RBS sample was also significantly older, with a 38% share of those age 65 and older, compared with 28% among the RDD sample. Respondents under 30 years of age constituted only 10% of the RBS sample but were 15% of the RDD sample (the actual population share for this age group is 22%).
The samples differed little in terms of educational achievement. As with most surveys, college graduates were substantially overrepresented relative to their actual share of the adult population. The RBS sample did produce a better gender distribution than the RDD sample. There were roughly equal numbers of men and women in the RBS sample, while the RDD sample was 58% male, 42% female. Within the RBS sample, there were relatively modest differences in the demographic composition of the registered voter and nonregistered samples. Hispanics made up 7% of the registered sample and 13% of the nonregistered sample.
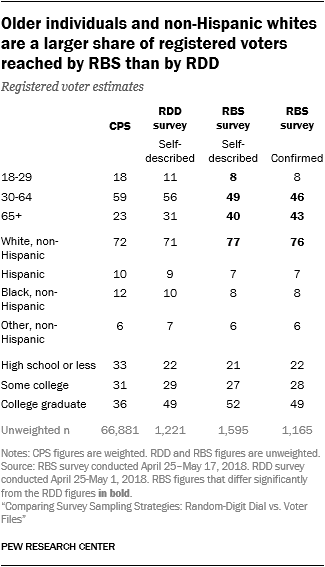
Among registered voters, the story was broadly the same. Both of the unweighted RV samples skew considerably older than the actual RV population. According to the CPS, about one quarter (23%) of registered voters in the U.S. are ages 65 and older, but among the confirmed RVs from the RBS sample in this study, the rate was 43%. By comparison, just 31% of the self-described RVs from the RDD survey were ages 65 and up.
The registered voter samples from the RBS survey also had disproportionately high shares of non-Hispanic whites (76% of the confirmed RVs sample compared to 72% based on the CPS). The racial and ethnic profile of the RDD RV sample, by comparison, aligned very closely with the CPS benchmarks. On education, all three RV samples over-represented college-educated RVs to a similar extent.
While the weighting applied to these RV samples eliminated nearly all of these demographic differences, the benchmark analysis suggests that the confirmed RV estimates remained a bit too influenced by older, retired adults.
RBS poll had larger design effects from weighting
The RBS and the RDD survey were weighted using the Center’s standard weighting protocol for RDD surveys,13 with an additional raking parameter of voter registration from the 2016 Current Population Survey Voting and Registration Supplement.14 One consequence of weighting is to increase the level of variability in survey estimates. The magnitude of this increase is captured by a measure known as the approximate design effect.15
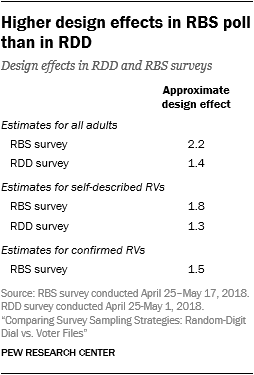
Using the weighting protocol employed for this study, the RBS survey had a higher design effect than the RDD survey. The approximate design effect for estimates of all U.S. adults based on the RBS survey was 2.2 compared with 1.4 from the RDD survey. In concrete terms, this means that after weighting, despite a nominal sample size of 1,800, the RBS sample was equivalent to a simple random sample of 818 adults. Although the RDD sample had a smaller nominal sample size of 1,503, the smaller design effect gives it an effective sample size of 1,071. Consequently, the margin of error after weighting is higher for the RBS poll than the RDD poll (3.4 and 3.0 percentage points, respectively).
The main contributing factor to the higher design effect was that the unweighted RBS sample (compared with the RDD sample) diverged more sharply from the population parameters on key weighting variables. Before weighting, the RBS survey had a higher share of non-Hispanic whites, adults with a bachelor’s degree or more and adults ages 65 or older. Sample design decisions for the RBS survey (e.g., sampling from both RV and non-RV databases and sampling records with no phone number) also impact the design effect. However, the effect of the demographic weighting adjustments was much larger.
Many people reached in the RBS survey were not the person on the voter record
In theory, one significant advantage of RBS surveys over RDD is that they provide the pollster with useful information about both the respondents interviewed and people who were selected but not interviewed. Using RBS, the pollsters can see the turnout history and modeled political partisan leaning for all of the sampled records before any interviewing is done. If the sample of people who take the survey looks different from those who do not, the pollster can statistically adjust the data to make it more representative.
But this idea rests on the assumption that the person interviewed is the same person whose registration record was selected. Anecdotally, several pollsters who use RBS have noted that the person who answers the phone is often not the person whose record was selected. Mismatches have several potential causes, such as the person on the sample record being deceased or just changing their phone number.
In fact, when designing this RBS study we heeded the vendor’s recommendation that it is impractical to require that the person interviewed match the person named on the sampled record when calling cellphones. As a result, this study implemented a two-track strategy. When interviewers called a cellphone, they interviewed whomever answered the phone, provided that they were age 18 or over. At the end of the survey, the interviewer asked if they were speaking to the person named on the sampled record. Roughly two-thirds of the time (62%) the respondent confirmed that was their name.
When interviewers called a landline in the RBS study, they started the interview by asking to speak with the person named on the sample records. Less than a third of the time (31%), the person answering confirmed that the name on the sample record belonged to them.
On the surface, these results might seem to suggest that it was easier to reach the person on the sample record when calling cellphone numbers than landlines. But that is not an accurate conclusion, because the landline confirmation was a screening question at the very beginning of the interview and the cellphone confirmation occurred at the end, making the two rates not directly comparable. It is well documented that screening questions tend to lead to motivated underreporting, such as declining to confirm in order to avoid an interview.[16. Tourangeau, Roger, Frauke Kreuter and Stephanie Eckman. 2012. “Motivated Underreporting in Screening Interviews.” Public Opinion Quarterly, 76: 453-469.]
Moreover, the cellphone rate is restricted to just the 916 cooperative people who completed the entire interview. The landline rate, by contrast, is based on a much larger pool of 3,292 people comprised mostly of people who simply gave some indication that the interviewer had reached the wrong number and were not interviewed. In other words, the denominator of the landline rate seems to contain cases that may have been eligible but were refusing the interview request. After consulting with the survey vendor, we determined that this was the cleanest way to compute the confirmation rate among the landline cases. In addition, the landline confirmation rate in this study may be lower than normal due to an oversight made by the sample vendor, in which the sample they initially provided did not include the most recent phone numbers available to them. The affected cases were updated during the field period, but this may have reduced the possibility of reaching the person on the sample record early in the field period.
While the exact name confirmation rates in this study may not generalize very well for a number of reasons, they do underscore the general difficulty in trying to interview the person corresponding to the sample record in an RBS survey.
CORRECTION (April 2021): A previous version of this report incorrectly stated the mean absolute difference between the RDD sample estimates and government benchmarks. None of the study’s findings or conclusions are affected.
