The random-digit-dial survey (RDD) was conducted according to Pew Research Center’s standard protocol for RDD surveys. Interviewing occurred April 25 through May 1, 2018, with 1,503 adults living in the U.S., including 376 respondents on a landline telephone (25% of the total) and 1,127 on a cellphone (75%). The parallel registration-based sampling survey interviewed 1,854 adults, with 916 interviewed on a landline (49%) and 938 interviewed on a cellphone (51%) using calling rules identical to those used for RDD surveys. Interviewing began April 25 and concluded on May 17, 2018. Both surveys included interviews in English and Spanish.
A total of 1,800 interviews were completed with a general population registration-based sample (RBS) and an additional 54 interviews were completed with respondents as part of an RBS Hispanic oversample. A decision was made during the fielding of the RBS survey to discontinue the Hispanic oversample due to exceedingly low productivity. None of the 54 interviews from the Hispanic oversample were included in analysis for this report. Abt Associates was the survey research firm.
Sampling
The sample for the RDD survey was drawn according to Pew Research Center’s protocol RDD surveys. A combination of landline and cellphone random-digit-dial samples were used. Both samples were provided by Survey Sampling International. Respondents in the landline sample were selected by randomly asking for the youngest adult male or female who is now at home. Interviews in the cell sample were conducted with the person who answered the phone if that person was an adult age 18 or older.
The sample vendor for the RBS survey was L2, a nonpartisan commercial voter file firm. The RBS survey featured a proactive strategy to deal with missing phone numbers. The sample was selected without regard for whether the record had a phone number available or not. First, the registered voter frame was sorted by vote frequency, political party affiliation, race and age. The frame for the unregistered was sorted by race and age. Samples stratified by state and presence of a telephone number were then selected from each frame. Sampled records without a phone were processed through Survey Sampling International’s telephone append service. The pre-append was able to match in a number for roughly a quarter (28%) of the records that had been missing a phone number. These numbers accounted for 46% of the RBS interviews.
After approximately 14,000 records were loaded for dialing, the RBS sample vendor determined that the sample it originally provided did not include the most recent phone numbers available. The sample was then sent back to L2 to provide updated telephone numbers. Some 6% of records had a new telephone number after the vendor corrected the issue.
Weighting
Both the RDD and RBS surveys were weighed in two stages. The first stage of weighting for the RDD survey accounts for the fact that respondents with both landline and cellphones have a greater probability of being included in the combined sample than adults with just one type of phone. It also adjusts for household size among respondents with a landline phone. For the RBS survey, the first stage weighting accounts for similar properties in the RDD survey as well as multiplicity in the registered and non-registered frame. The first-stage weighting in the RBS also adjusts for differential probabilities of selection in areas that are more or less likely to have listed respondents without a phone number.
For the second stage, both surveys were weighted using an iterative technique to match national population parameters for sex, age, race, Hispanic origin, region, population density, telephone usage and self-reported voter registration status. Voter registration is not typically used by Pew Research Center as a weighting variable for its RDD surveys but was employed here in order to assure that the RDD and RBS samples were identical with respect to this important indicator of political engagement.21
No additional weighting was done to self-reported registered voters for either the RDD and RBS surveys since both full samples were weighted to targets for the total adult population. Confirmed registered voters in the RBS sample (respondents that were reached through the registered-voter file and confirmed they were the person that was sampled) were weighted to match population parameters among registered voters for sex, age, race, Hispanic origin and region from the 2016 CPS Voting Supplement.
The margins of error reported and statistical tests of significance are adjusted to account for the survey’s design effect, a measure of how much efficiency is lost from the weighting procedures.
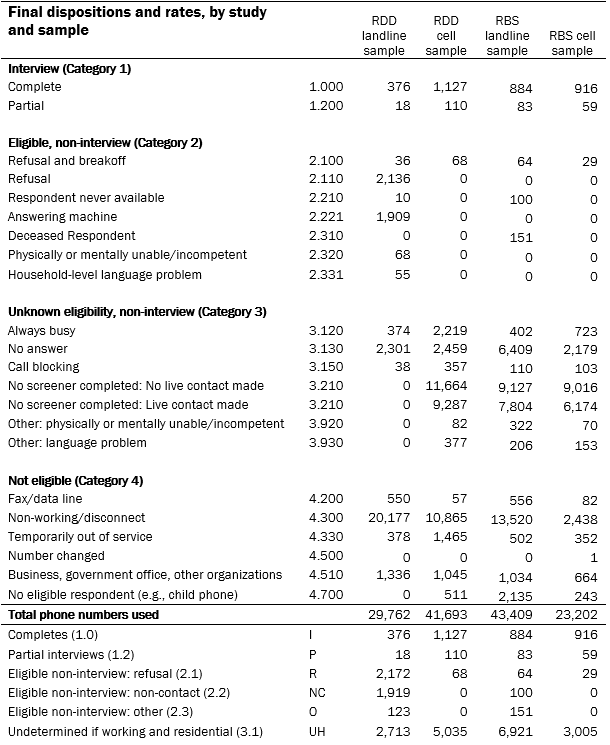
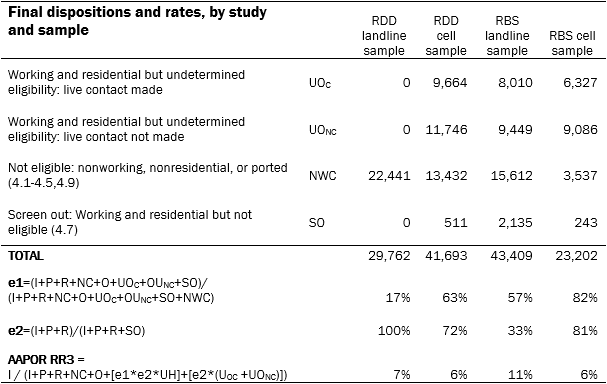
Dispositions by frame and sample


Why the projected response rate goes down when the matching requirement in the RBS survey is removed
When Center researchers projected what the response rate for the RBS landline sample would have been if the survey had interviewed any adult, rather than requiring that the person interviewed match the sampled record, the response rate for that study component dropped from 11% to 4%. It is not necessarily intuitive why that happens.
The explanation stems from a quirk in how response rate formulas deal with uncertainty. At the end of many surveys, there are some sampled records for which the respondent’s eligibility for the study is unknown. Landline RBS cases in this study where classified as uncertain if interviewers were never able to speak with someone and determine whether the person on file lived in the household (e.g., because they no one answered or they hung up immediately).
Pollsters deal with that uncertainty by using the eligibility rate of similar records to compute a data-driven estimate for what share of the uncertain cases were in fact eligible for the survey. The lower that data-driven estimate, the fewer uncertain cases are counted against the response rate (that is, fewer are considered to be refusals to participate). In this study, the data-driven estimate for the share of uncertain landline RBS cases that were likely to have been eligible was 33% (see “e2” in the third column of the above table), which was how often interviewers confirmed that the person on record lived at the household reached on the phone. Consequently, only one-in-three uncertain cases were counted against the response rate. Without the matching requirement, any adult would have been eligible, putting the data-driven estimate at basically 100% (which it is in landline RDD samples). When 100% of the cases with uncertain eligibility are assumed to have been eligible, all such cases are counted against the response rate, driving it down. In this study, the RBS response rate drops to 4% under this scenario.


