All told, we tested 16 different variations on four types of likely voter methods, producing estimates that range from a 2-point Democratic lead to a 7-point Republican advantage in the generic U.S. House vote. The benchmark for comparison is a 3-point Republican lead among verified voters (49% Republican, 46% Democratic) when they were interviewed prior to the elections. While there is no objective way to know where the race stood at the time the September poll was conducted, this benchmark is our comparison of choice. With hindsight and a voter file, we are able to know what voter preferences a perfect likely voter measure – one that included 100% of eventual voters and zero nonvoters – would have produced with this survey.
Cutoff methods
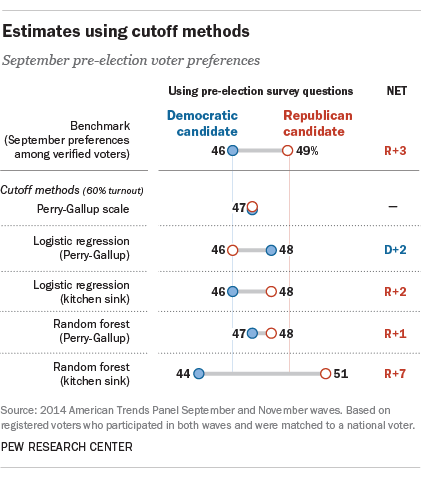
Using a 60% registered voter turnout cutoff (projecting a 42% overall turnout), the Perry-Gallup index yielded a tied race, at 47% for each party’s candidate. A more accurate prediction can be obtained if a lower turnout forecast is used (see Appendix C), but given that the actual turnout in the sample was 63%, a tighter turnout screen would be inappropriate.
A logistic regression to produce probabilities of turnout, using the standard seven likely voter questions with a 60% cutoff, produced a 2-point Democratic edge (48% vs. 46% Republican). Adding demographic and political variables from the pre-election survey (the “kitchen sink”) improved the predictions, yielding a 2-point Republican advantage.
Probabilities produced with a random forest model (using the Perry-Gallup items and the same 60% cutoff) produced a 1-point GOP advantage (48% to 47%). Adding the demographic and political variables drove the forecast well past the benchmark, to a 7-point GOP lead.
Weighting methods
Using predicted vote probabilities as weights produced results similar to those from the cutoff method. As noted earlier, using the probabilities as a weight as opposed to using a cutoff means including all respondents, even those who may have a lower likelihood of voting; they are simply given a lower weight in the analysis than others with a higher likelihood of voting.
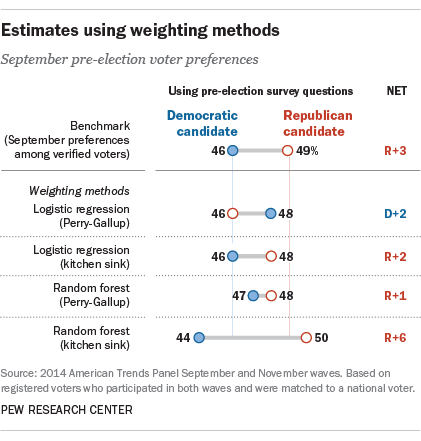
Weights computed from logistic regression with the basic Perry-Gallup variables resulted in a forecast of a 2-point Democratic advantage (48% to 46%). Adding the kitchen sink of demographic and political variables shifted the estimate to a 2-point GOP edge.
Computing the probabilities with the random forest method produces a 1-point GOP advantage (48% to 47%), while adding the kitchen sink produced a 6-point GOP advantage, 3 points larger than the benchmark.
Adding voter file history
Adding voter file records of verified past turnout history for the 2010 midterm elections and the 2012 presidential elections widens or creates a Republican advantage for nearly every prediction, in most cases improving estimates of the 2014 vote compared with the benchmark.
In particular, adding evidence of past turnout to the logistic regression using the Perry-Gallup scale and the 60% cutoff produced a much more accurate result, turning a 2-point Democratic advantage into a 2-point Republican advantage.
Adding the vote history variables to the traditional Perry-Gallup scale with a 60% cutoff made less of a difference. With vote history, this approach produced a 1-point GOP edge (48% GOP, 47% Democratic); without those variables, the model produced a tie (47% to 47%).
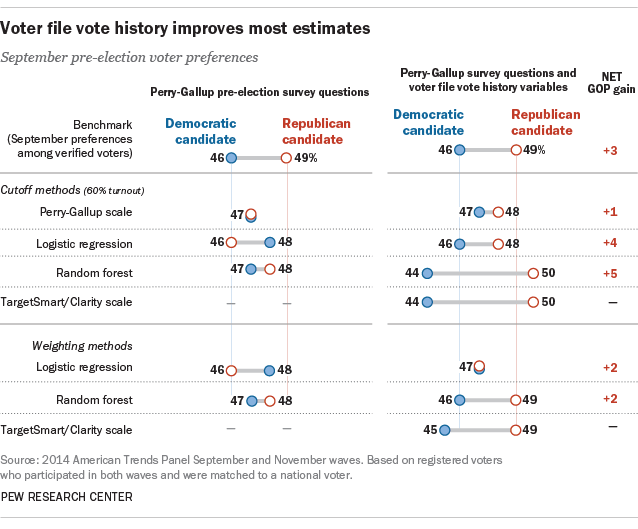
Adding vote history from the voter file to the random forest model estimates produced an estimate that was 2 points more Republican than the benchmark (50% Republican, 44% Democrat).
When vote history variables are included in models and employed as a weight, similar improvements are observed. Including the vote history in the random forest model produces a forecast that matches the benchmark (49% Republican, 46% Democratic). With the logistic regression, the vote margin moves from a 2-point Democratic lead (without the vote history variables) to a tie (47% for both). The TargetSmart/Clarity turnout score, which includes past vote history from the voter file, produced a 4-point GOP advantage when used as a weight.
It’s important to keep in mind that the probabilistic methods tested here have an advantage over the original Perry-Gallup method, in that they have been computed using verified turnout in the current election as the dependent variable. While they produce more-accurate results in this test than the traditional Perry-Gallup method, their broader applicability depends on the assumption that the survey measures will be related to voter turnout in other elections in the same way that they are in 2014. By contrast, the Perry-Gallup approach has proven to be accurate in a wide range of elections for several decades.
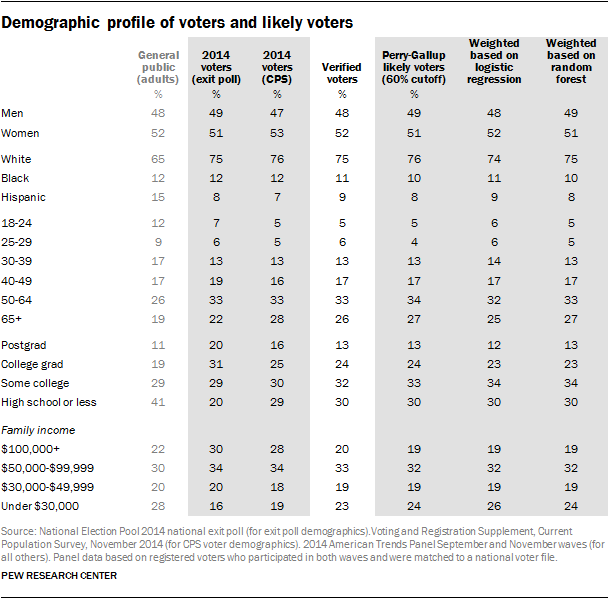
Comparing the demographic profiles of likely electorates
When election pollsters apply a likely voter screen to their data, they look at more than its impact on the candidate preference question. They are also interested in what that model suggests about the makeup of the likely electorate in terms of key demographic groups. The different methods examined here produce likely electorates that are similar in terms of gender, race and age. In addition, they were not notably different on key characteristics – such as the share that is black or Hispanic, or ages 65 and older – from the profiles of the 2014 electorate produced by the 2014 national exit poll and the Voting and Registration Supplement conducted by the U.S. Census Bureau. The exit poll finds a somewhat better-educated and more affluent electorate than our survey. In particular, two-in-ten voters (20%) validated through the national voter file report family incomes of $100,000 or more annually, compared with 30% of voters in the national exit poll and 28% in the Census survey. This difference is potentially consequential because more affluent voters were considerably more Republican in their vote preferences than were the less affluent.