The American Trends Panel survey methodology
Overview
The American Trends Panel (ATP), created by Pew Research Center, is a nationally representative panel of randomly selected U.S. adults. Panelists participate via self-administered web surveys. Panelists who do not have internet access at home are provided with a tablet and wireless internet connection. Interviews are conducted in both English and Spanish. The panel is being managed by Ipsos.
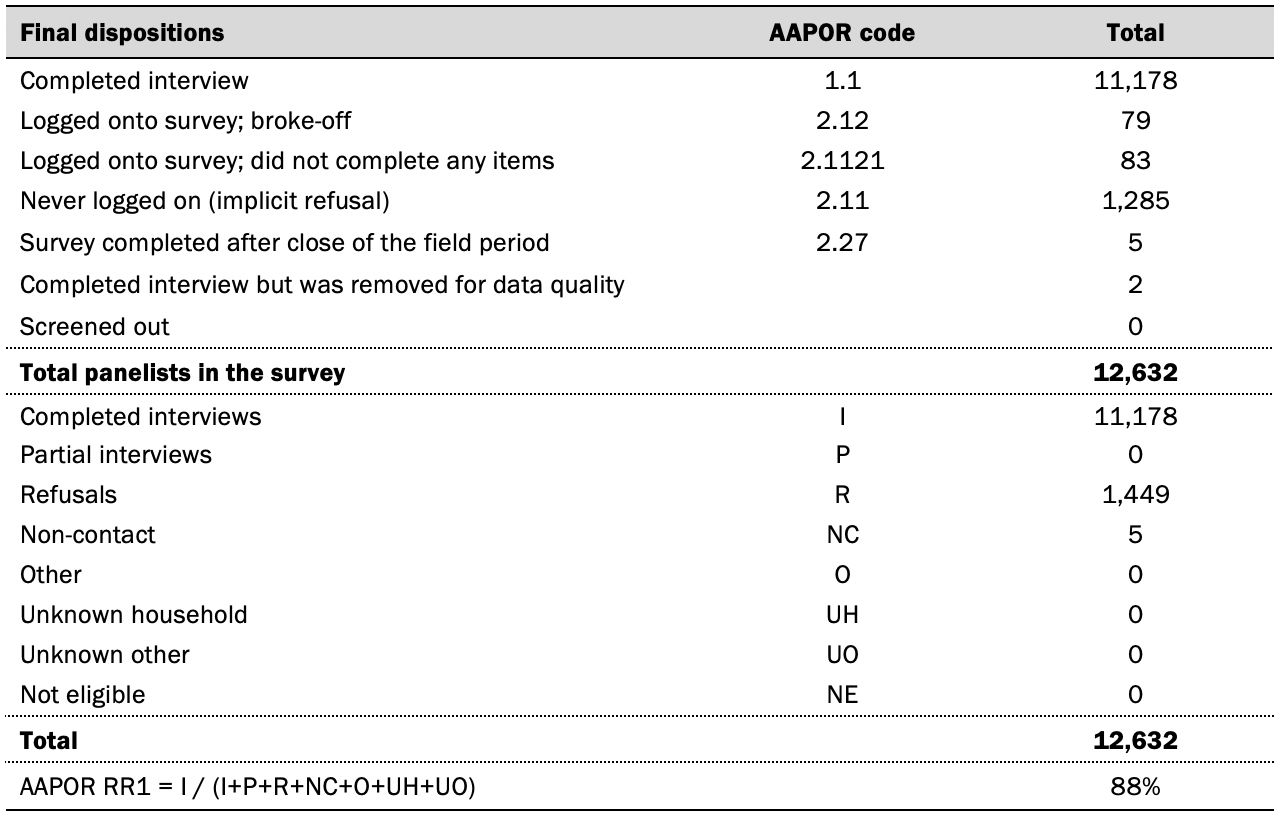
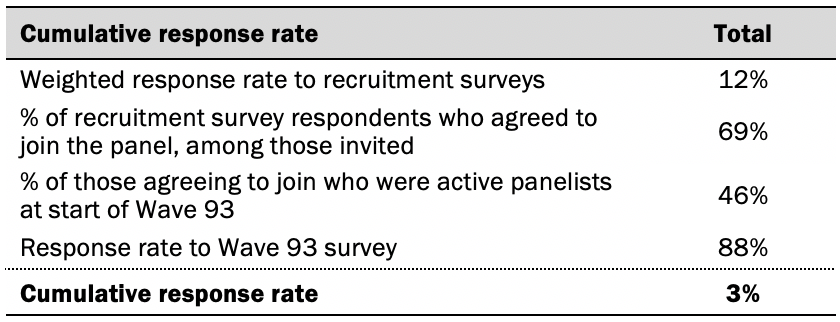
Data in this report is drawn from the ATP Wave 93, conducted July 26 to Aug. 8, 2021. A total of 11,178 panelists responded out of 12,632 who were sampled, for a response rate of 88%. The cumulative response rate accounting for nonresponse to the recruitment surveys and attrition is 3%. The break-off rate among panelists who logged on to the survey and completed at least one item is 1%. The margin of sampling error for the full sample of 11,178 respondents is plus or minus 1.4 percentage points.
This is the latest report in Pew Research Center’s ongoing investigation of the state of news, information and journalism in the digital age, a research program funded by The Pew Charitable Trusts, with generous support from the John S. and James L. Knight Foundation.
Panel recruitment
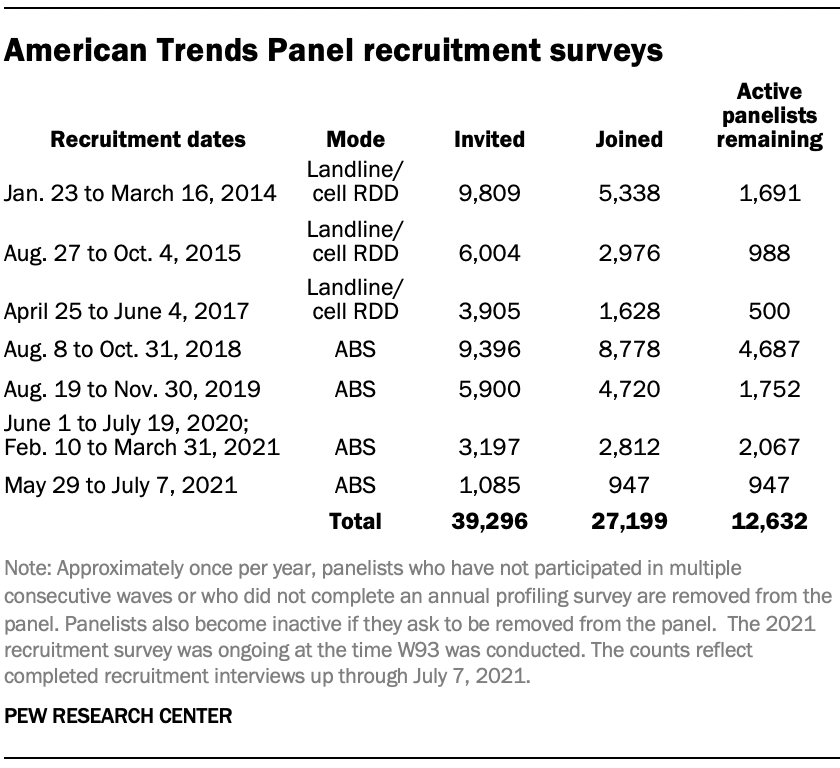
The ATP was created in 2014, with the first cohort of panelists invited to join the panel at the end of a large, national, landline and cellphone random-digit-dial survey that was conducted in both English and Spanish. Two additional recruitments were conducted using the same method in 2015 and 2017, respectively. Across these three surveys, a total of 19,718 adults were invited to join the ATP, of whom 9,942 (50%) agreed to participate.
In August 2018, the ATP switched from telephone to address-based recruitment. Invitations were sent to a random, address-based sample of households selected from the U.S. Postal Service’s Delivery Sequence File. Three additional recruitments were conducted using the same general method in 2019, 2020 and 2021. Across these four address-based recruitments, a total of 19,578 adults were invited to join the ATP, of whom 17,257 agreed to join the panel and completed an initial profile survey. In each household, the adult with the next birthday was asked to go online to complete a survey, at the end of which they were invited to join the panel. Of the 27,199 individuals who have ever joined the ATP, 12,632 remained active panelists and continued to receive survey invitations at the time this survey was conducted.
The U.S. Postal Service’s Delivery Sequence File has been estimated to cover as much as 98% of the population, although some studies suggest that the coverage could be in the low 90% range.2 The American Trends Panel never uses breakout routers or chains that direct respondents to additional surveys.
Sample design
The overall target population for this survey was non-institutionalized persons ages 18 and older, living in the U.S., including Alaska and Hawaii.
Questionnaire development and testing
The questionnaire was developed by Pew Research Center in consultation with Ipsos. The web program was rigorously tested on both PC and mobile devices by the Ipsos project management team and Pew Research Center researchers. The Ipsos project management team also populated test data which was analyzed in SPSS to ensure the logic and randomizations were working as intended before launching the survey.
Incentives
All respondents were offered a post-paid incentive for their participation. Respondents could choose to receive the post-paid incentive in the form of a check or a gift code to Amazon.com or could choose to decline the incentive. Incentive amounts ranged from $5 to $20 depending on whether the respondent belongs to a part of the population that is harder or easier to reach. Differential incentive amounts were designed to increase panel survey participation among groups that traditionally have low survey response propensities.
Data collection protocol
The data collection field period for this survey was July 26 to Aug. 8, 2021. Postcard notifications were mailed to all ATP panelists with a known residential address on July 26, 2021.
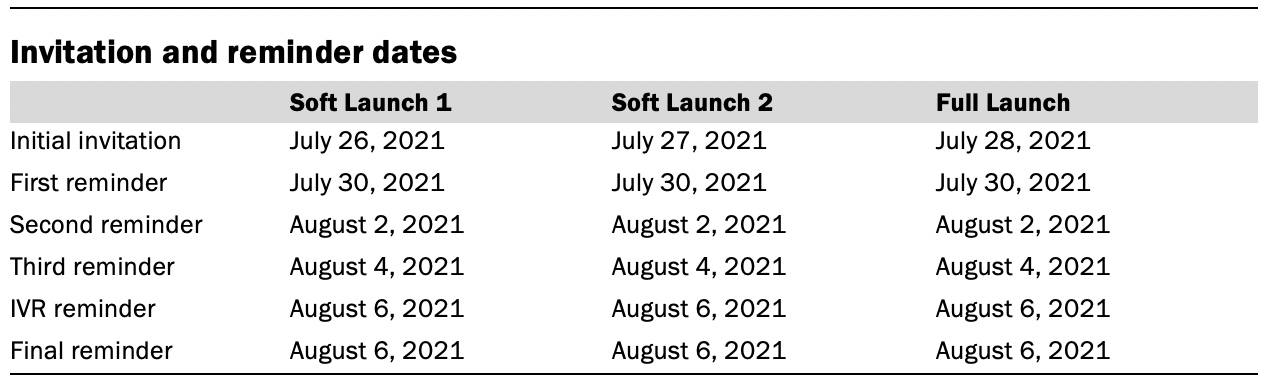
Invitations were sent out in three separate launches: two Soft Launches and a Full Launch. Sixty panelists were included in the first soft launch, which began with an initial invitation sent on July 26, 2021. An initial invitation to the second soft launch was sent to an additional 58 panelists on July 27. The ATP panelists chosen for the soft launches had completed previous ATP surveys within one day of receiving their invitation. All remaining English- and Spanish-speaking panelists were included in the full launch and were sent an invitation on July 28.
All panelists with an email address received an email invitation and up to four email reminders if they did not respond to the survey. All ATP panelists that consented to SMS messages received an SMS invitation and up to four SMS reminders. Interactive voice recording (IVR) reminder calls were made on Aug. 6, 2021, to 43 tablet households that previously provided consent to receive these reminders.
Data quality checks
To ensure high-quality data, the Center’s researchers performed data quality checks to identify any respondents showing clear patterns of satisficing. This includes checking for very high rates of leaving questions blank, as well as always selecting the first or last answer presented. As a result of this checking, two ATP respondents were removed from the survey dataset prior to weighting and analysis.
Weighting
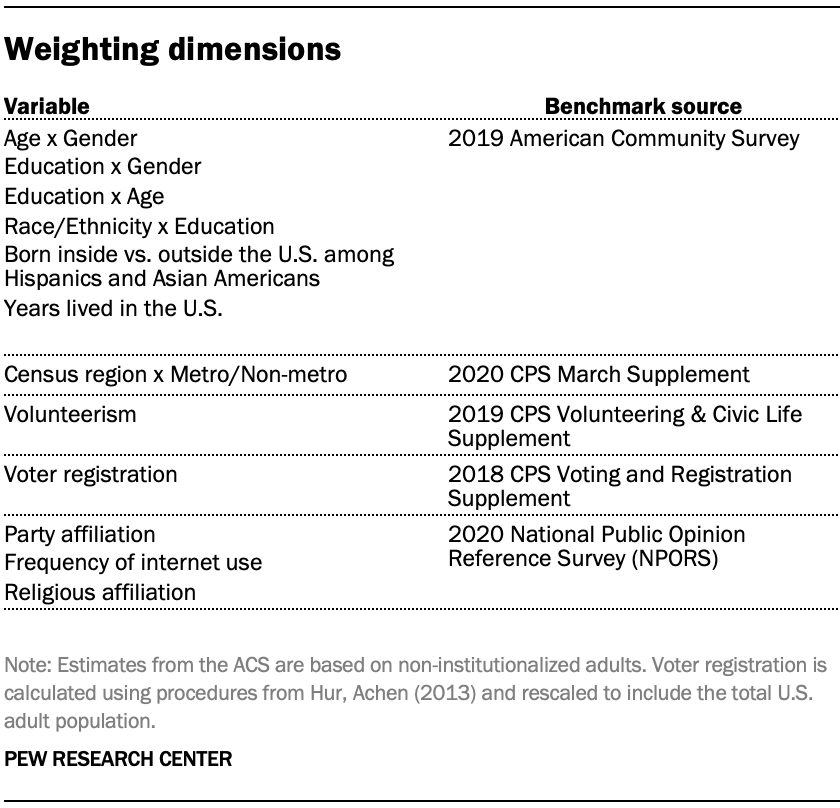
The ATP data was weighted in a multistep process that accounts for multiple stages of sampling and nonresponse that occur at different points in the survey process. First, each panelist begins with a base weight that reflects their probability of selection for their initial recruitment survey. Among respondents to Wave 93, the base weights for panelists recruited in different years were scaled to be proportionate to the effective sample size for all respondents in their cohort. These base weights were then calibrated to align with the population benchmarks identified in the accompanying table and trimmed at the 1st and 99th percentiles to reduce the loss in precision stemming from variance in the weights. Sampling errors and test of statistical significance take into account the effect of weighting.
The population benchmarks used for weighting come from surveys conducted prior to the coronavirus outbreak that began in February 2020. However, the weighting variables for new panelists were measured when they were recruited in 2021. Likewise, the profile variables for preexisting panelists were updated with current measurements on either this survey (Wave 93) or in July 2021 on Wave 91.
This does not pose a problem for most of the variables used in the weighting, which are quite stable at both the population and individual levels. However, volunteerism and party identification in particular may have changed over the intervening period in ways that make their 2021 measurements incompatible with the available (pre-pandemic) benchmarks. To address this, volunteerism and party identification are weighted using the profile variables that were measured in 2020. For all other weighting dimensions, the more recent panelist measurements from 2021 are used.
For panelists recruited in 2021, plausible values were imputed using the 2020 volunteerism and party values from preexisting panelists with similar characteristics. This ensures that any patterns of change that were observed in the preexisting panelists were also reflected in the new recruits when the weighting was performed.
The following table shows the unweighted sample sizes and the error attributable to sampling that would be expected at the 95% level of confidence for different groups in the survey.
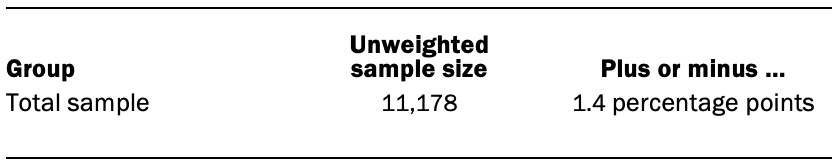
Sample sizes and sampling errors for subgroups are available upon request. In addition to sampling error, one should bear in mind that question wording and practical difficulties in conducting surveys can introduce error or bias into the findings of opinion polls.
Dispositions and response rates
© Pew Research Center, 2021