
Given the challenges of survey research detailed above, it is worth considering other approaches to measuring news consumption – especially when it comes to getting news online. One possibility is so-called “passive” data, in which respondents’ online activity is recorded automatically by a computer tracker. Several vendors now offer these types of panels: They recruit a sample of respondents who allow their PCs or mobile devices to be tracked and their activity recorded, although respondents are free to leave the panel at any time by deleting or disabling the tracker. Researchers have been intrigued by the possible ways this data could be useful in understanding online activity, including online news use.
The advantage of passive data is that it does not rely on people’s self-reporting of their own behavior, which can be subject to both imperfect recall and aspirational responses by those who value the news but do not actually consume it at the levels they say they do. A second advantage of passive data collection is that it arguably reduces the burden on respondents, removing the need for them to answer questions about their digital behavior.
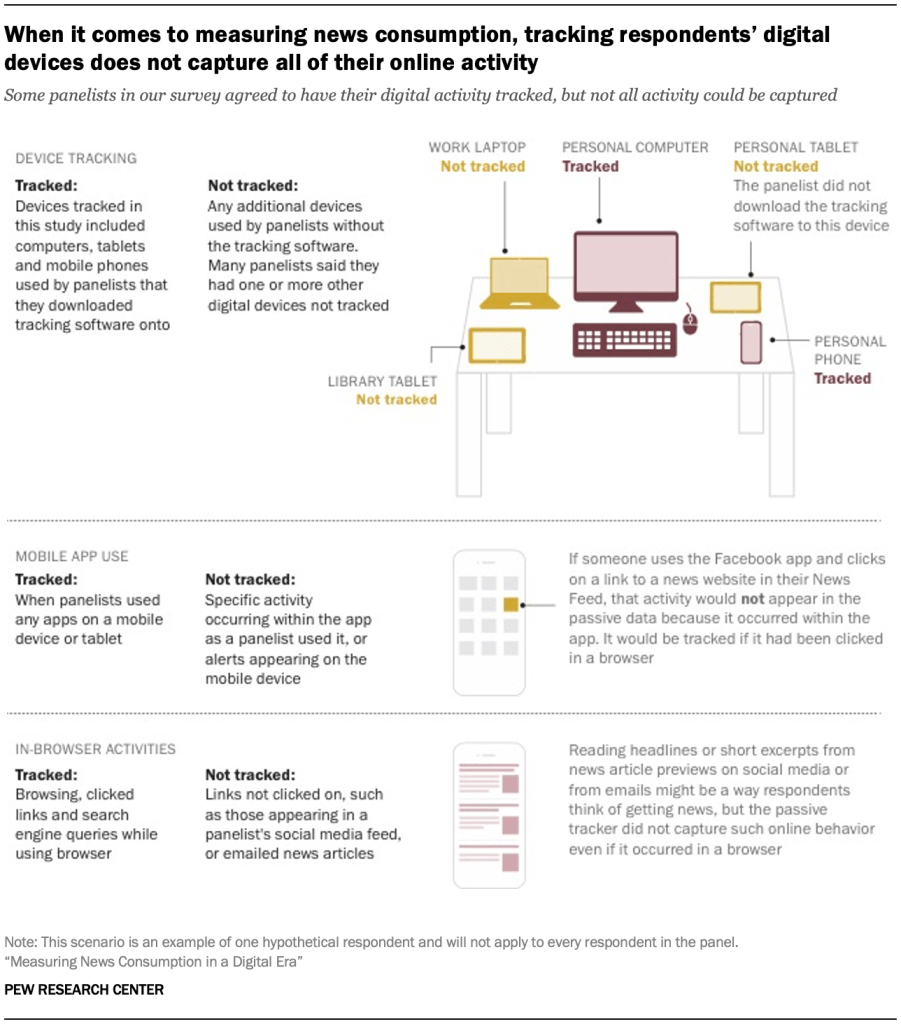
But passive data collection is not without its limitations. Notably, digital tracking commonly used with survey panels excludes all offline consumption, such as television, radio and print newspapers or magazines. At present, television is one of the primary platforms Americans use to get news, but it is not covered by typical passive tracking.6 Due to this exclusion of offline behavior, digital tracking alone cannot provide a complete picture of Americans’ news consumption. Even within online behavior, passive tracking is not fully comprehensive, in part because in-app behavior (e.g., viewing news on Facebook) is not captured, nor are emails or push alerts from news organizations, unless the recipient clicks or taps on the link.
Two additional limitations of passive data concern not the tracking technology but the public’s willingness to use it. Passively tracked adults need to permit the tracking on all their devices in order for the data to represent the full breadth of their usage. But that is a questionable assumption on several levels. Some Americans use employer-issued computers and smartphones, in which cases the employee may not be allowed to install tracking software on those devices. This means that, for some adults, all the news that they consume on an employer-issued device would be excluded from tracking. Employer-related restrictions aside, it is simply more burdensome and invasive to install the tracking on all the devices people use, as opposed to just one device. Full coverage may thus not be a feasible request of panelists.
A final question surrounding passive data collection is whether the people willing to participate in the tracking are nationally representative or skewed toward demographic groups (e.g., younger and more educated adults) who tend to be more comfortable with technology and adept at installing new software.
It is worth noting that the capabilities of passive tracking have evolved (and improved) over time. Some panels could only track users on their PC or mobile device – but not both. Others could not see which pages were visited in a browser. Since this methodology is still being developed, it is possible that some or all of these limitations will be addressed in the future.
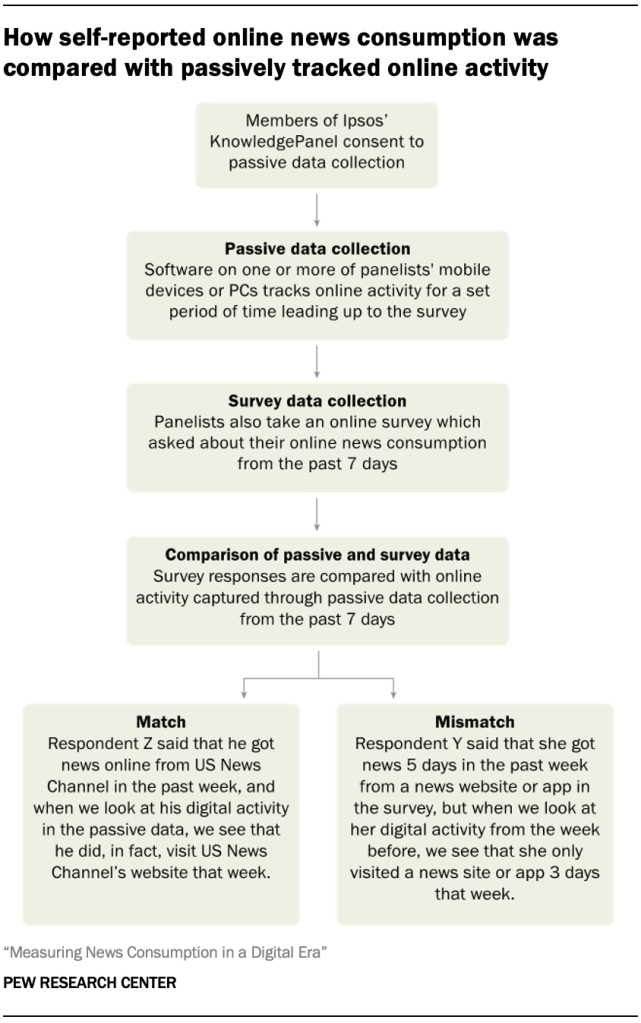
To explore these advantages and disadvantages of passive data, Pew Research Center researchers designed a study to compare passively collected data to survey self-reports from the same individuals. A national sample of adults consented to passive digital tracking, installing trackers from RealityMine that used a VPN, mobile app, software package, or browser extension to record all activity on their PCs and/or mobile devices. This same group also completed a news consumption survey, self-reporting their online behavior in a few different ways:
- Days in the past week they got news from online news sites or apps
- Whether they got news online from each of 15 news organizations in the past week7
- Days in the past week they used each of six social networking services8
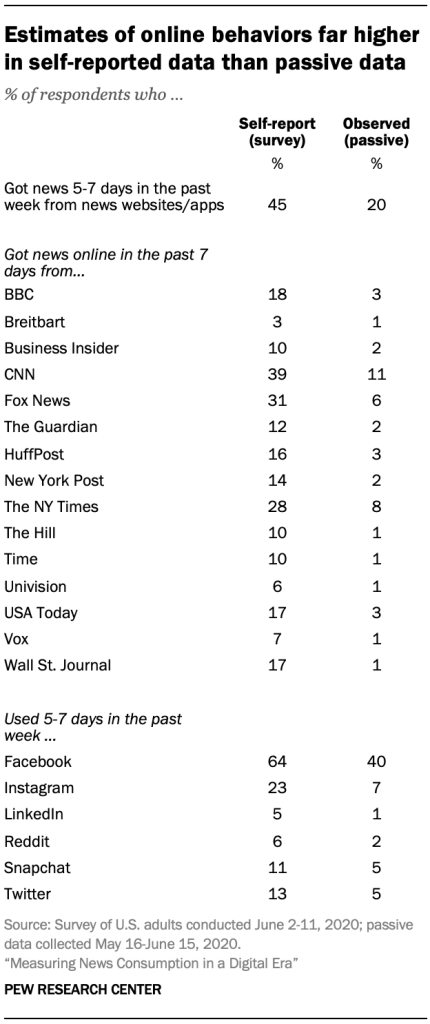
These responses were then compared with the passive data. The estimates of news consumption resulting from the two different methods – survey self-report and passive data – differ widely. For nearly every item asked about, self-reporting produces higher totals than the passive data.
What are the implications for news consumption research? Are survey estimates inflated, or is the passive data underestimating respondents’ news habits due to limitations in what can be collected? Or both? Two approaches seek to shed light on these questions. First, secondary data – traffic data from a commercial vendor that tracks visitors to news websites and apps – is used as a comparison point. Second, further analysis of the survey and passive data seeks to ascertain what is driving the differences between the self-report and passive data – and whether more sizable effects arise from potential sources of error in the survey or passive data.
The comparison finds that both the passive data and survey data contain flaws. Numerous passively generated estimates for the share of Americans visiting news websites in the past week are implausibly low when triangulated against traffic data from a commercial metrics vendor. Meanwhile, a number of the survey-based estimates are likely inflated by aspirational responding (also known as social desirability bias).
For researchers seeking to measure Americans’ complete news diet, however, the underestimates in the passive data stemming from insufficient coverage seem to be the greater of the two challenges, at least at the present time. Predictably, the survey data do appear to overstate news consumption to some extent, but they do a better job capturing the many varied ways that Americans continue to get their news.
Respondents self-report online activities at far higher rates than what passive data shows, but it is unclear which is more accurate
The most basic question in evaluating the potential of passive data for measuring news consumption is the overall estimates it produces for the portion of Americans who engage in each activity. This can then be compared with the estimates that result from the survey.
Respondents were asked: “In THE PAST 7 DAYS, how many days did you get news from a news website or app?” This is the type of broad measurement researchers are interested in when it comes to news consumption. To match it to the passive data, a list of over 2,500 local and national news organizations’ websites was constructed from commercial databases. Their Android or iOS apps, if available, were included as well. A respondent was deemed to have visited a news website or app if their passive data matched any entry on this list.
The results show a large gap. In the passive data, only one-in-five respondents used a news website or app between five and seven days in the week prior to their interview. In the survey, however, nearly half of respondents (45%) say they used news websites or apps five to seven days in the past week, a 25 percentage point gap between survey and passive estimates.
It may be difficult for respondents to remember all the news sites and apps they have visited, however, potentially leading them to make an estimate based on their general sense of their news behaviors rather than an actual accounting of their activity in the past week. The survey, then, also included more directed questions: Respondents were asked about the use of 15 specific news organizations’ websites and apps. Here, however, the same pattern is evident, with survey estimates consistently higher than results from the passive data. For instance, roughly a quarter of survey respondents (28%) say they got news online from The New York Times in the past week, while only 8% of respondents show a matching behavior in the passive data (i.e., visited nytimes.com or the Times’ Android or iOS apps within the week before their interview date).
Still, the passive data does not include in-app activity on social media, so it may be that some respondents did see content from the organization online at some point without visiting their site in a browser or using their app. To account for this, the survey also included questions about the use of social media sites and apps, since these are distinct presences with fewer measurement issues, even though use of social media in general is not part of the scope of news consumption research. Here again, however, there are large gaps, with more people reporting that they used social media than the passive data showed.
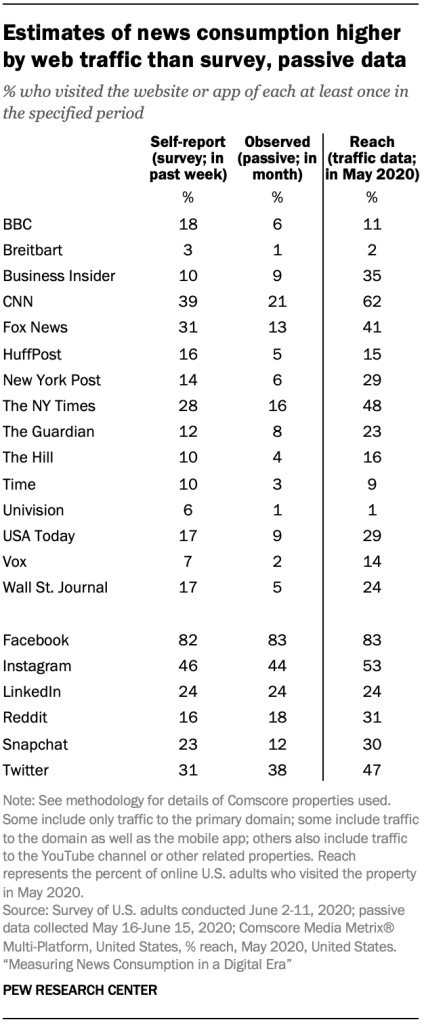
This would seem to confirm earlier research that found survey estimates of news consumption greatly inflated relative to estimates emerging from behavioral data such as ratings or trackers.9 But when two data points differ, it makes sense to bring in a third data source as a triangulation point. Traffic data is the natural place to turn to as a comparison point for online news consumption. Web traffic data is used by online publishers in much the same way TV ratings or circulation figures are used: to measure their overall performance as well as to set ad rates. Here, we can turn to data from Comscore to see what its data indicates about the portion of the population that visited different online properties in a month.
When bringing in this traffic data, however, the reach – the percentage of online U.S. adults who visited the property at least once in the given month – for individual news organizations and social media sites and apps is generally higher than both the survey and passive estimates. The survey estimates are closest to the traffic data, though they are not an exact conceptual match.10
Comscore data represent a third approach, one that incorporates passive data but also uses analytics data generated by “tagged” webpages and apps. Similar to the respondents to this study, Comscore maintains a panel of users whose online activity is tracked and recorded. But their media clients also place a small piece of code on their websites and in their apps that registers every time it is visited or used. These two data sources are combined to calculate overall traffic. This second stream of data, from “tagged” pages, would necessarily capture some visits that are not valid, whether because they are from a “bot” or because they are not within the target population being measured (e.g., U.S. adults). The panel data can be used to correct for these issues, as well as to provide estimates in and of themselves. Thus, it is a hybrid approach different from both the survey and passive data analyzed here.
For example, 31% of U.S. adults reported visiting the website or app of Fox News in a one-week period in the survey, much higher than the 13% who were observed doing this in the passive data (reanalyzed to cover a one-month period). But traffic data shows that 41% of online Americans visited the website or app of Fox News at some point in May 2020.
Note that the metric here measures only the barest use: at least one visit in an entire month. As such, it would not capture what some media researchers have been searching for when it comes to news consumption: a measure of heavy, habitual or regular consumers of each source, so their media habits can be linked to their attitudes.
Regardless, the hoped-for clarity does not emerge from this triangulation. Given evidence that survey responses are likely inflated, it would be wishful thinking to see these as validation of the survey approach. The wide spread among the three sources suggests that nailing down a precise point estimate for news usage remains elusive.
Accounting for differences between survey and passive data
Another way to answer the question of whether the passive data or self-reported data is more accurate is to assess the influence of various sources of error. For instance, errors in the passive data could result from respondents’ devices not being fully tracked, while errors in the survey data could result from respondents overreporting their news consumption due to social desirability – i.e., they believe it is important to follow the news and consciously or subconsciously want to represent themselves as good citizens – ones who often consume news. If errors from inadequate device coverage were more likely to drive mismatches than social desirability, the blame for the mismatches could be laid more squarely on the passive data. And vice versa – if social desirability is found to be the major culprit for error, then the blame would fall on the survey.
Three areas of potential error stood out: issues with how the passive data are collected, such as coverage of all devices a respondent uses or the ability to gather data from inside apps; social desirability, lack of knowledge about the news media, or other factors affecting the survey responses; and the composition of the sample that could be recruited, which could affect both the passive and survey data.
Potential error resulting from passive data collection
Device coverage
Americans can use multiple devices to access the internet – from their personal smartphone or laptop to their work computer to a shared computer in their home or elsewhere. To gain a comprehensive picture of their online activity, trackers would ideally be installed on all devices a panelist uses.
When asked in the survey if all the devices they use to access the internet were being tracked, however, only 28% of respondents said this was the case. About two-thirds (68%) said one or more devices they use to access the internet were not being tracked.
This less-than-full coverage was not for lack of trying. About one-in-five panelists (19%) were tracked on more than one device. In contrast to some panels that only track PC or mobile usage, this data captured both: 50% were tracked on at least one PC and 63% were tracked on at least one mobile device. (This data is unweighted.)
While the survey did not ask directly which devices were untracked, most panelists do not access the internet using devices not owned by themselves or someone in their household (e.g., work or library devices). One-in-ten report using a smartphone or tablet they do not own, and about a quarter (24%) use a PC they do not own. Thus, it is possible that many people simply own multiple devices and did not have the tracking software installed on all of them.
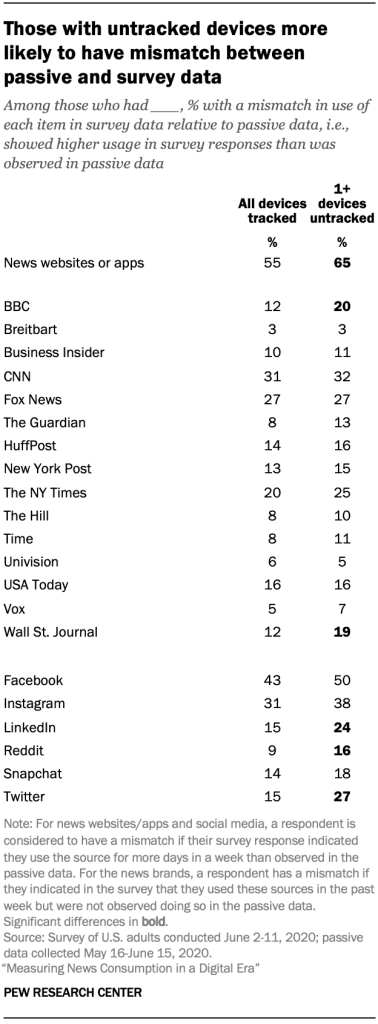
An analysis found that those who say they did not have all their devices tracked were more likely to have a mismatch between the results in the passive and survey data (i.e., indicate higher usage in the survey than could be measured in their passive data) for some of the items, especially the social media items.11 For example, among those who say they had at least one untracked device, 27% showed a mismatch for Twitter, compared with 15% of those who say they had all devices tracked. However, for the 15 news organization items, there were only two (BBC and The Wall Street Journal) for which having untracked devices was related to a higher incidence of mismatching.12
The only demographic difference on the question about untracked devices was by education. A third of those with a high school degree or less said they had all of their devices tracked, while this was true of 29% with some college education and 21% of college graduates.
A ‘blind spot’ for news consumption within social media apps
While the tracking software captures the use of apps, it does not capture activity that happens within the app. So, for instance, if a panelist visits nytimes.com on their smartphone browser (such as Safari on an iPhone or Chrome on an Android device), this would be captured, as would any time they used the mobile app of The New York Times (though not which stories they read inside the app). However, if they are using the Facebook app and tap on a link to a nytimes.com story, this would not be captured – nor would any links to nytimes.com that appear in their Facebook news feed but are not clicked on. Given the sizable portion of Americans who get news on social media, this blind spot for in-app activity is effectively a social media blind spot when it comes to measuring news consumption through device tracking.13
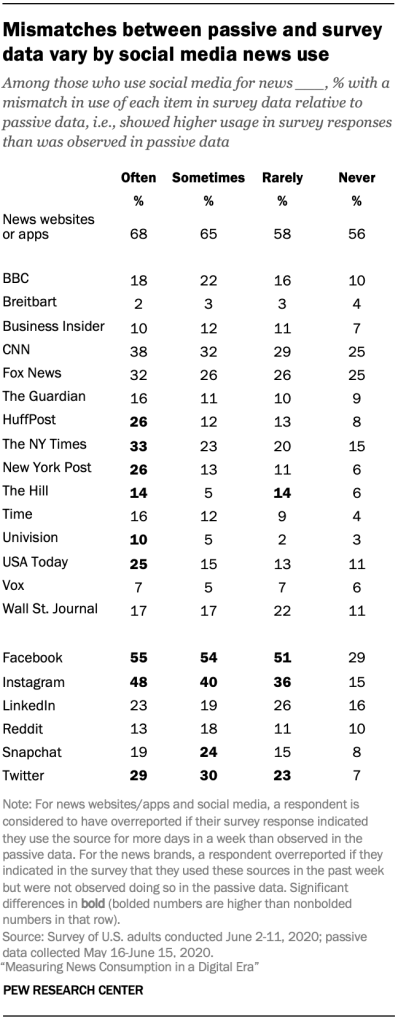
An analysis found that those who said in the survey that they often get news from social media were generally more likely to show a mismatch than those who say they got news from social media less often. For example, among those who often get news from social media, a quarter showed a mismatch between the portion that get news online from USA Today in their passive and survey responses – in other words, indicated higher usage in their survey responses than was evident in their passive data – compared with 15% or fewer among those who get news from social media less often.
However, such a gap might be expected given that those who say they follow the news more often in general also are more likely to have a mismatch. About one-in-five respondents who follow the news often (21%) showed a mismatch for USA Today, compared with 10% of those who follow the news less often.
Digging even deeper, researchers divided respondents into those who were tracked on just mobile devices, just PCs or on both mobile devices and PCs. If the social media blind spot is driving mismatches, this should only be evident on mobile devices, since on PCs any clicked link would open in the browser window and would be tracked.
Those who were tracked on both PC and mobile were significantly less likely to have a mismatch on use of news websites and apps (49%) than those tracked on just PCs (61%) or just mobile (66%). But there was no consistent pattern for mismatches when it comes to specific news organizations or social media sites. For example, there was a mismatch for USA Today among 16% of those tracked on PC and mobile, 15% of those tracked just on mobile, and 18% of those tracked just on PC – statistically indistinguishable figures.
This, then, suggests that the issue isn’t that in-app activity on mobile isn’t being picked up, but that heavy news consumers – including those who get news on social media – are generally more likely to have a mismatch.
Potential sources of error in survey data
Social desirability
Research has shown that survey respondents may overestimate their self-reported level of activities they see as socially desirable, though self-administered web surveys (such as this one) may mitigate this effect. They also may overreport activities they see as important to them personally. To help gauge this effect, the survey asked respondents: “Thinking about what it means to be a good citizen, how important is it to follow what is happening in the news?” Those who say it is very important see news consumption as a socially desirable activity. (Respondents also were asked about volunteering, which showed similar results to the question analyzed here.)
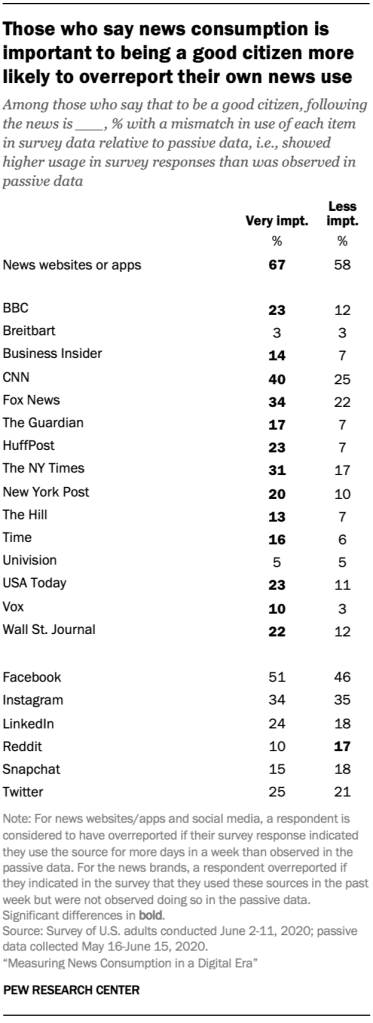
Social desirability inflates survey estimates relative to passive data: Those who said news consumption is important to being a good citizen were more likely to have a mismatch on most news items. For example, among those who say keeping up with the news is very important, 23% showed a mismatch on use of the BBC online, compared with 12% who said it was less important. This pattern is not seen on the items about social media usage, suggesting this social desirability effect is limited to news organizations.
Knowledge
Aside from aspirational overreporting, it is possible that respondents could have cognitive difficulty in accurately recalling their news consumption habits over the past week with the specificity required. Those with higher knowledge of the news media may have more accurate recall of where they got news from online.
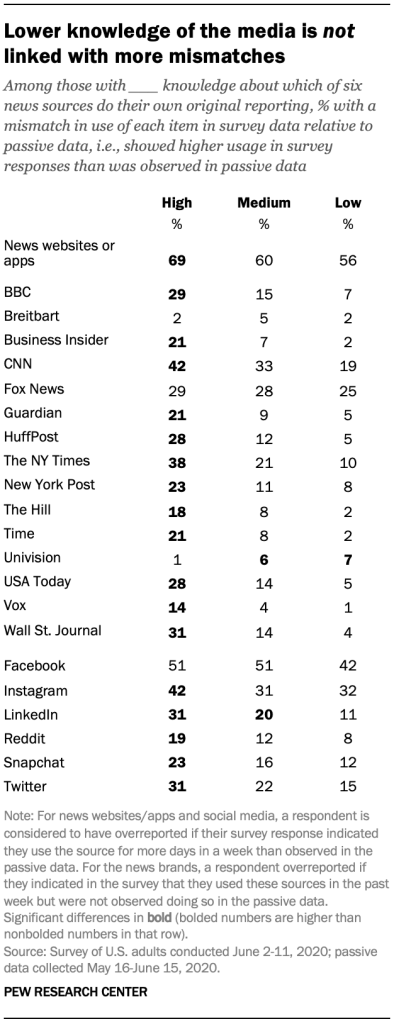
While no index of news knowledge or news literacy was included on the survey, some questions can be leveraged to produce a post-hoc measure – specifically, the battery asking whether six places to get to news do their own original reporting. Respondents were grouped into three categories: those who correctly identified one or fewer items (low knowledge), two or three items (medium knowledge) or four or more items (high knowledge).
The results do not support the hypothesis: Those who have higher knowledge of which news organizations do their own reporting were more likely to have a mismatch – not less. This pattern is also evident for education. Those with a college degree are more likely to show a mismatch than those with less formal education (see detailed tables). As such, it would not appear that respondents’ lack of knowledge is driving overreporting.
The results here are, at least in part, an artifact of the close relationship between knowledge and news use. Higher knowledge is closely tied to higher self-reported news use in general; this is also the case for education. And, as discussed above, those who say they get news more often are generally more likely to show a mismatch.
But why are those with more frequent (self-described) overall news consumption more likely to show a mismatch? Are they driven by social desirability effects to overreport? Or are they more likely to have news behaviors that are not getting picked up in the passive data, such as on social media or on work devices? The results here are unclear.
Sample composition
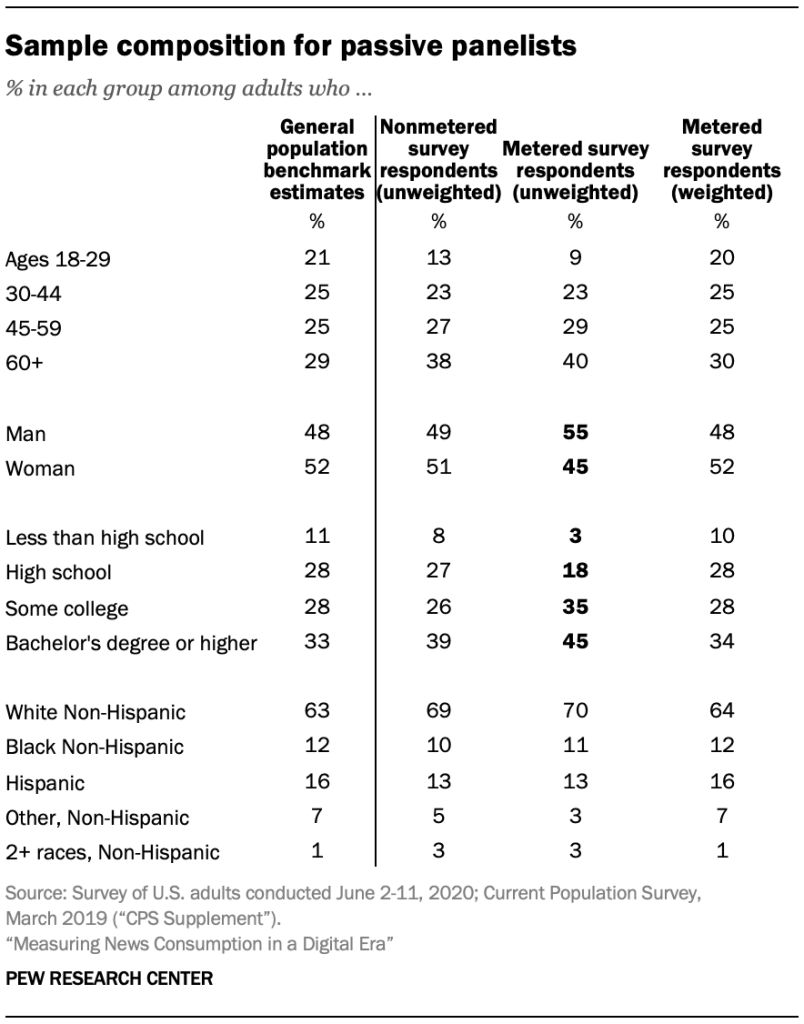
While the results above are weighted to match national estimates, there are some differences between the unweighted portions of nonpassive survey respondents (the nationally representative sample whose results are discussed in Chapter 1) and passive survey respondents. These differences could be affecting both the survey and passive estimates. Part of the discrepancy could have to do with the heavy burden of allowing a tracking device or with loss of privacy.
Passive panelists are more likely to be a man and to have more formal education. While gender does not drive mismatches between survey and passive data, those with a college degree are more likely to show a mismatch. This could be due to their disproportionate representation in the sample, though results were weighted.
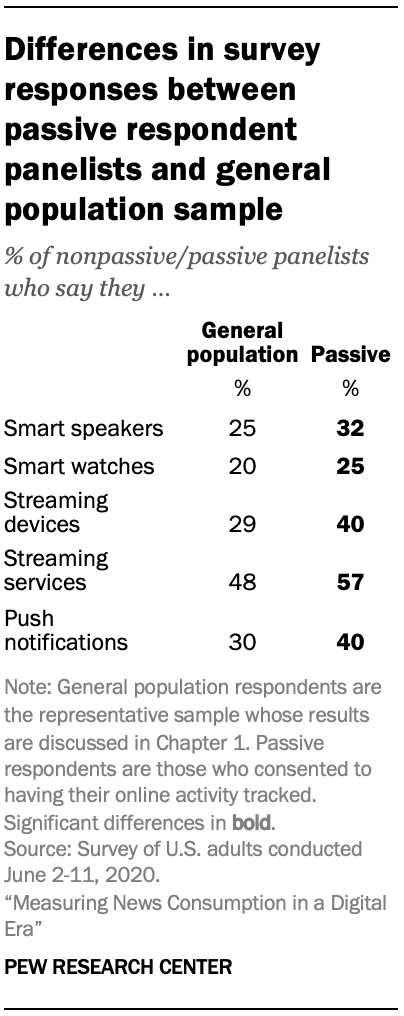
In addition, there are some differences in the (weighted) survey responses of passive and nonpassive panelists, with passive panelists showing greater awareness and use of some digital platforms. This suggests that the passive panelists are somewhat more online-oriented than the population at large, meaning that both their survey and passive data could be inflated compared with what we might see for a general population sample.
Passive panelists are more likely to say they know a lot about digital devices and services, including smartwatches, streaming devices and push notifications.
However, there are no differences in their use of different news providers. There is also no difference in their reported volunteering for organizations or associations.


