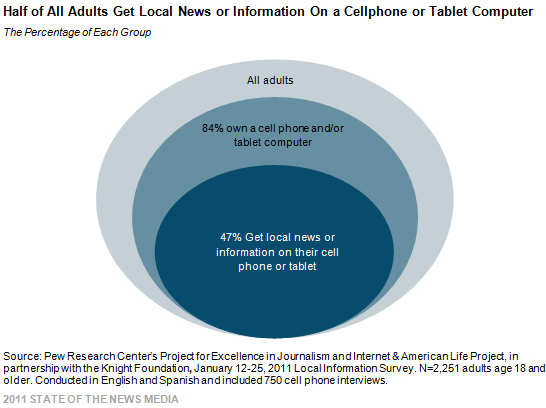
Local news is going mobile. Nearly half of all American adults (47%) report that they get at least some local news and information on their cellphone or tablet computer.
What they seek out most on mobile platforms is information that is practical and in real time: 42% of mobile device owners report getting weather updates on their phones or tablets; 37% say they get material about restaurants or other local businesses. These consumers are less likely to use their mobile devices for news about local traffic, public transportation, general news alerts or to access retail coupons or discounts.
One of the newest forms of on-the-go local news consumption, mobile applications, are just beginning to take hold among mobile device owners.
Compared with other adults, these mobile local news consumers are younger, live in higher income households, are newer residents of their communities, live in nonrural areas, and tend to be parents of minor children. Adults who get local news and information on mobile devices are more likely than others to feel they can have on impact on their communities, more likely to use a variety of media platforms, feel more plugged into the media environment than they did a few years ago, and are more likely to use social media:
- 35% of mobile local news consumers feel they can have a big impact on their community (vs. 27% of other adults)
- 65% feel it is easier today than five years ago to keep up with information about their community (vs. 47% of nonmobile connectors)
- 51% use six or more different sources or platforms monthly to get local news and information (vs. 21%)
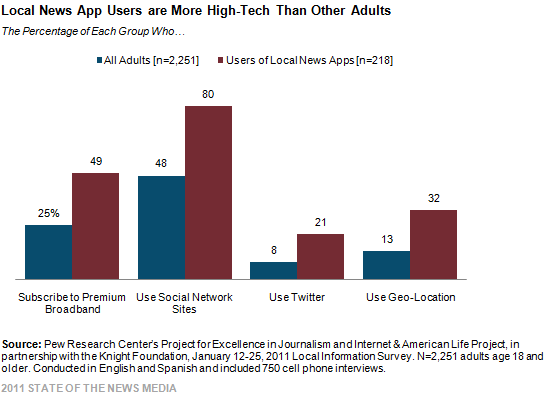
- 75% use social network sites (vs. 42%)
- 15% use Twitter (vs. 4%)
Tablets and smartphones have also brought with them news applications or “apps.” One-quarter (24%) of mobile local news consumers report having an app that helps them get information or news about their local community. That equates to 13% of all device owners and 11% of the total American adult population. Thus while nearly 5 in 10 get local news on mobile devices, just 1 in 10 use apps to do so. Call it the app gap.
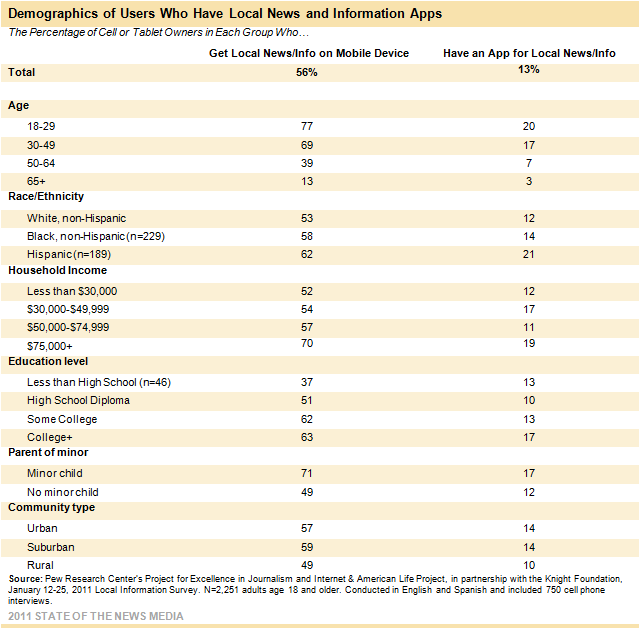
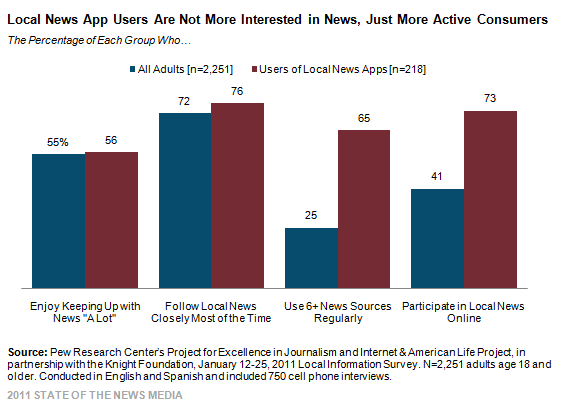
These mobile app users skew young and Hispanic. They are also much more active news consumers than other adults, using more sources regularly and “participating” in local news by doing such things as sharing or posting links to local stories, commenting on or tagging local news content, or contributing their own local content online.
Many news organizations are looking to mobile platforms to provide new ways to generate revenue in local markets. The survey suggests there is a long way to go before that happens. Currently, only 10% of adults who use mobile apps to connect to local news and information pay for those apps. This amounts to just 1% of all adults.
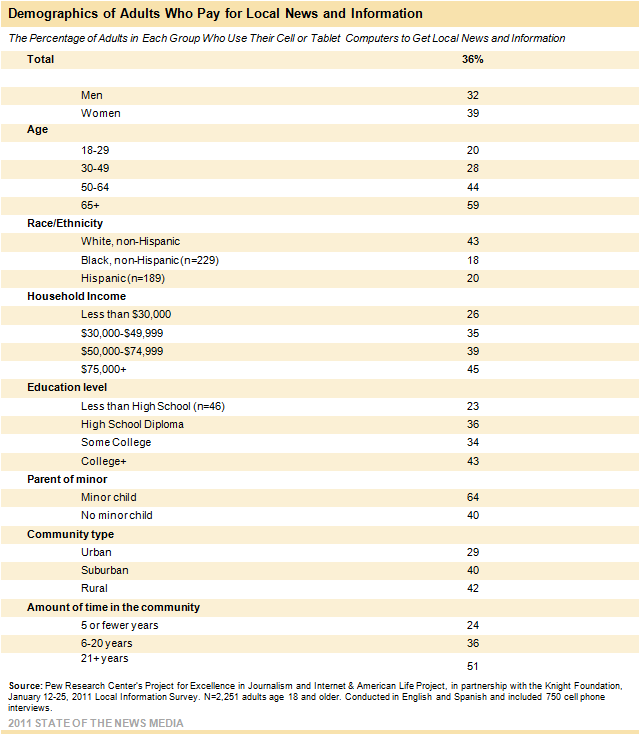
When it comes to payments for news more broadly, 36% of adults say they pay for local news content in some form – be it for their local print newspaper, for an app on their mobile device or for access to special content online. The vast majority of those who pay for local news, 31% in all, are paying for local print newspaper subscriptions and only a fraction are paying for apps or for access online to local material.
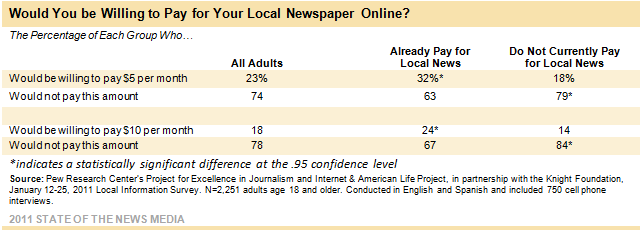
One question in the news industry is whether the willingness to pay for online content would grow if people faced the prospect of their local media not surviving otherwise. Pressed on the value of online access to their local newspaper, 23% of survey respondents say they would pay $5 a month to get full access to local newspaper content online. When asked if they would pay $10 per month, 18% of adults say yes. Both figures are substantially higher than the percentage of adults (5%) who currently pay for online local news content. Nonetheless, roughly three-quarters say they would not pay anything.
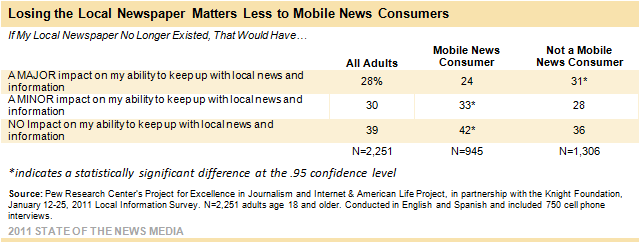
Asked the value of their local newspaper, respondents are divided. Just under a third (28%) say the loss of the local newspaper would have a major impact on their ability to keep up with local information. Another 30% say it would have a minor impact. But the plurality — 39% — say the loss of the newspaper would have no impact.
This survey is being released as a part of the Project for Excellence in Journalism’s 2011 State of the News Media Report. These results come from a national phone survey of 2,251 American adults (age 18 or more) in English and Spanish. Some 750 of the interviews were conducted on cellphone. The margin of error for the full sample is +/- 2 percentage points.
Part 1: Mobile news takes off
The rise of mobile digital devices has already altered the environment of local news and information. Traditional news organizations and other community-based information providers are trying to respond to audience interest with pervasive, portable, real-time local information. To understand this changing information environment, the Pew Research Center’s Project for Excellence in Journalism and Internet & American Life Project conducted a national survey in partnership with the Knight Foundation. The survey used both landline and cellphones. The survey was conducted in English and Spanish from January 12 to 25, 2011, and involved 2,251 adults ages 18 and older. Our aim was to explore the role that cellphones and tablet computers play in people’s patterns of consuming and contributing to community information. A major share of the funding for the survey came from the John S. and James L. Knight Foundation; its senior leaders participated in constructing the survey and assessing the data.
Cellphone usage has already penetrated deep into American society. Fully 84% of American adults own a cellphone, a figure that has remained relatively stable since mid-2008. Now tablets are spreading quickly as well. Indeed, the survey finds that tablet computers such as the iPad, which have existed less than a year, have become one of the most quickly adopted consumer goods of the recent era; tablet penetration almost doubled in just four months’ time, from 4% to 7% now. (As virtually all iPad owners are also cellphone users, the total population of mobile device owners (cellphone and/or tablet users) is 84%.
Two-thirds of cellphone users take advantage of mobile phone features such as texting, e-mailing, web browsing and “apps” (software applications that allow mobile device users to play games, access web content and access media or data). Only a third of Americans now say they use their cellphones just for phone calls, according to the survey.
Some local news goes mobile
The majority of those of who own a cellphone or tablet computer (56%) get some kind of local news and information on their mobile devices. That equates to 47% of all adults.
Adults tend to use mobile devices to get local news and information that serve an immediate need. We asked specifically about the kinds of local informationobtained through mobile devices. The most sought-after material was local weather. About 4 in 10 mobile phone and tablet owners (42%) use their mobile device to access local weather information. That represents 36% of all American adults.
The next biggest category among cellphone and tablet owners was information on restaurants or other local businesses (37%). General local news came next (30%), followed by other news such as up-to-the minute information of local sports scores (24%) and the latest local traffic and transportation (22%).
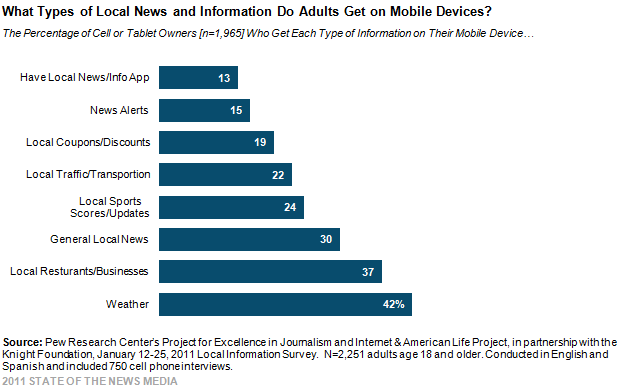
Mobile access to coupons and discounts from local businesses, on the other hand, has yet to be used widely. The same is true for local news alerts.
Respondents were also asked a separate series of questions about what sources they rely on most for a wide range of local news areas. This list of areas asked about included crime, community events, schools and education, politics and cultural events and social services. Just a small fraction cited a mobile device as a primary source for any of these. Thus, for now, the data indicate that mobile devices are mainly a supplemental platform for local news and information, not a primary source.
Who consumes local information on the go?
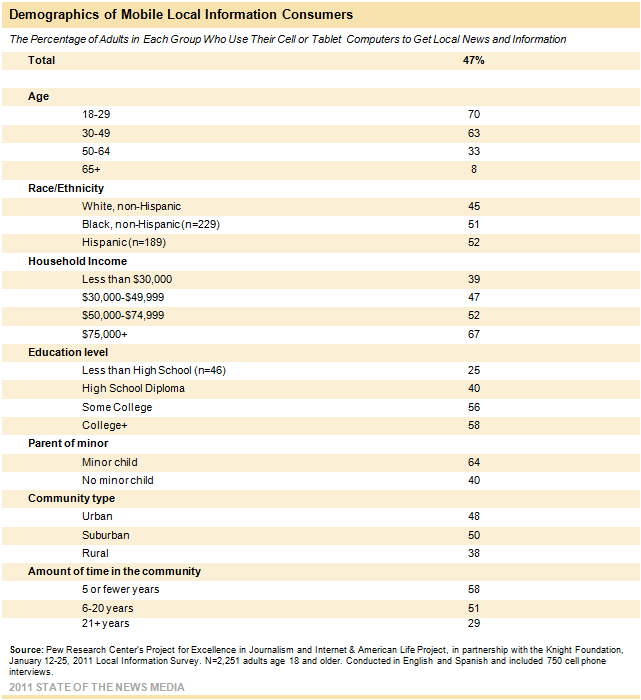
Adults who consume local news on the go reflect many of the same traits as owners of mobile devices: They are disproportionately young, affluent, highly educated and live in non-rural communities. This group also tilts towards newer residents of their communities.
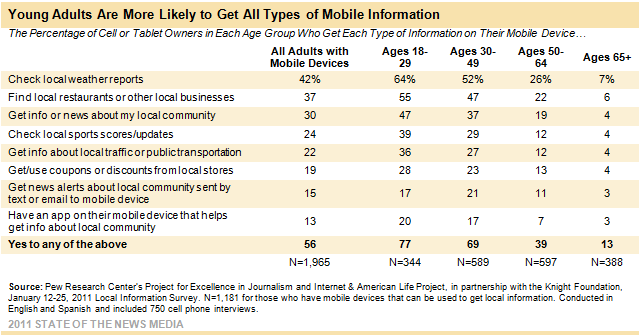
Younger users are also more likely than others to use their mobile devices for specific types of local news and information. The one exception is among those receiving local news alerts sent by text or e-mail to mobile devices. Here, mobile device-owning adults age 30-49 are slightly ahead of those 18-29. Still, the results suggest that if these patterns hold as people age, mobile is likely to become a much more powerful factor in news consumption.
In addition, among cell/tablet owners, those with higher household incomes and higher levels of educational attainment are more likely to use their mobile devices to get these kinds of local information. Overall, 63% of college graduates who own cellphones or tablets get local news and information on their mobile devices, compared with just 37% of cell/tablet users who have not completed high school. Likewise, 7 in 10 cell/tablet owners (70%) with household incomes of at least $75,000 get local news on their mobile devices, compared with just over half of cell/tablet users with incomes below that level (54%).
Mobile users are plugged into their communities in special ways
Those who use their cellphones or tablet computers to get local news are more enthusiastic in some respects than others about their communities and the role they play there. They are also more likely to feel that technology has made news consumption easier, and to take advantage of a wide range of media sources.
- More than a third (35%) of mobile local information consumers say they and others like them can have a big impact on their community. That compares with 27% of those who do not connect to their communities on their mobile devices who feel that level of personal efficacy.
- Nearly two-thirds of mobile local information connectors (65%) feel it is easier today than five years ago to keep up with information about their community. That compares with 47% of nonconnectors who feel that way.
- Half (51%) of mobile local news consumers report using six or more sources/platforms monthly to get local news and information. That is more than double the number (21%) for those who do not consume local information on their mobile devices.
- Among adults who are online, 75% of mobile local information connectors use social network websites vs. just 42% of those who do not get local information on their mobile device.
- On-the-go local information connectors are almost four times more likely to be users of Twitter. Among adults who are online, 15% of on-the-go local information connectors use Twitter vs. just 4% of nonconnectors.
Local news apps
The growth in tablet and smart phone use has brought with it a growing use of news applications, or apps. The adoption of apps, however, is not as rapid as tablets themselves. In the current survey, just over 1 in 10 mobile device owners (13%) report having an app that helps them get information or news about their local community. That equates to 11% of the total American adult population, and represents one-quarter (24%) of mobile local news consumers.
Some 89% of adults who have an app that helps them access local news or information got the app for free. Even among these avid local information consumers, just 10% paid for the app on their cellphone or tablet computer. That amounts to 1% of the entire adult population. There are no notable demographic patterns in distinguishing those who pay for local apps versus those who download them for free. (See more on paying for local news in Section II of this report.)
In some ways, the quarter of mobile connectors who have apps for local news and information resemble early adopters, and in other ways they do not. For instance, while they skew younger than other cell owners and other adults in general, which is typical of early tech adoption, they also are more likely to be Hispanic than other cell owners. And while the most educated and highest earners often lead the way with new technologies, the pattern of local news app adoption across income and education categories is not as stark or consistent as is normally the case.
One interesting feature of local app users is that they are not necessarily more interested in news in general, or in local news specifically. In fact, they are no more likely than other adults to say they enjoy keeping up with news “a lot” or say that they follow local news closely most of the time, even when nothing important is happening.
Part 2: Paying for local news
For news organizations, one of the most significant elements of mobile technology is its potential to offer new revenue opportunities. Until now, news producers have struggled to generate revenue in the digital sphere to support local news. A variety of factors have contributed to this — from the fact that small local businesses may not be as quick to adapt to online advertising to the inability of news organizations to charge users for content online. Many in the news and information business hope that mobile will change that. Mobile offers news firms the chance to offer advertisers geo-targeted ads based on a user’s immediate location. Some media executives also believe that tablets may improve the consumer’s interface with advertising by making it work more seamlessly with other content – as opposed to the way that display advertising on websites often annoys news consumers. The apps available on mobile devices also offer news companies what the browser environment has not — a chance to charge subscription fees for content.
In addition, local news is a largely untapped and undeveloped market for news companies. Many local advertisers such as restaurant owners or small-business people are not yet online. At the same time, technology companies like Google and Facebook are moving more heavily into soliciting and enabling local advertising.
The value of local news
To adjust to these changing circumstances, many news organizations are focusing new energy and resources on local news. They have reoriented staff away from national and international issues in order to expand operations in their own communities. One model of revenue generation that is garnering particular attention is the paid local app model. The local news apps used by 13% of adults who own mobile devices, or 11% of all adults, may encompass a wide range of applications, including locally focused news organizations, apps for broader sites likes Craigslist that provide online classified ads organized by community, and even more specialized apps such as the Girl Scouts’ Cookie Locator App, which helps users find the nearest location to buy Girl Scout cookies.
Currently, only 10% of adults use mobile apps to connect to local news and information have paid for those apps, according to our survey. This represents only 1% of the total U.S. adult population. The vast majority access their local apps for free.
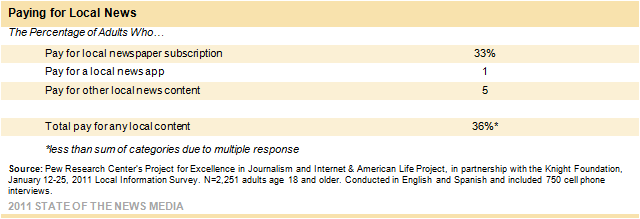
This reflects a broader trend captured in the survey. A series of questions measuring paid local news content revealed that just 36% of adults pay for any local news content. For the vast majority, that comes in the form of newspaper subscriptions. One in three adults (33%) report paying for a local newspaper subscription; just 5% report paying for local news in some other form such as a blog or other online venue.
Could those numbers increase if circumstances change? To find out, the survey asked about the willingness of people to pay for an online subscription to their local newspaper if the paper otherwise could not survive. People were asked “If the only way to get full access to your local newspaper online on your computer, cell phone or other device was to pay a … monthly subscription fee, would you pay it or not?” While currently 5% of adults report paying for local news content online, nearly a quarter (23%) say that they would be willing to pay at least a small amount if that were the only way to access their local newspaper.
The survey also probed to what extent price is a factor. Half of the sample was asked if they would pay $10, and half of the sample was asked if they would pay $5. Price did make some difference. While 23%, said they would be willing to pay $5 per month, that figure dropped to 18% among respondents who were asked if they would pay $10 per month. In both questions, roughly three-quarters of adults say they would not be willing to pay for online access to their local newspaper, even if it was the only way to access the newspaper’s content. As one might expect, those who already pay for local news are significantly more likely to say they would pay a fee to access their local newspaper online.
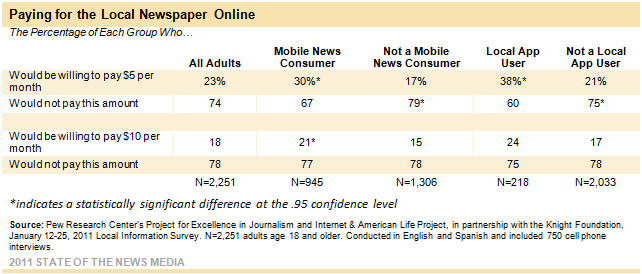
In what may be a positive sign to news organizations, adults who consume their news on mobile devices are more likely than other adults to say they would be willing to pay a fee. Mobile news consumers are almost twice as likely as other adults to say they would pay a $5 monthly fee for access to their local newspaper online (30% vs. 17%). And among local app users, 38% are willing to pay that amount. There is less enthusiasm among mobile news consumers and local app users when the proposed fee is $10 per month.
The demographics of this cohort willing to pay did not stand out as very different from the population overall. College graduates and adults with household incomes of at least $75,000 are slightly more likely than the least educated and lowest income adults to say they would be willing to pay a monthly fee. And African-American (27%) and Hispanic (27%) adults are slightly more likely than white adults (18%) to be willing to pay a fee.
The perceived importance of local newspapers
The flip side of the question of who would pay online and how much, perhaps, is how much people might miss their local newspaper if it were to disappear. By a small margin, more people would seriously miss the paper if it died than said they would be willing to pay for it online. In general, though, respondents were split on the whether their ability to keep up with what is happening in their communities would be affected.
When asked, “If your local newspaper no longer existed, would that have a major impact, minor impact, or no impact on your ability to keep up with information and news about their community?”, the responses were as follows:
- 28% of adults said the loss of the newspaper would have a major impact on their ability to keep up with local information. Most likely to answer this way were adults over age 50, non-internet users, those who get news from multiple sources, those who had lived in the community more than 20 years and those who say they enjoy keeping up with the news.
- 30% said the loss of the newspaper would have a minor impact. This response was most common among adults from relatively high-income households and those with higher levels of educational attainment, adults who use multiple sources for news and mobile local news consumers.
- 39% said the loss of the newspaper would have no impact. Most likely to respond this way were younger adults (under age 50), those with broadband at home, those who say they do not enjoy getting news and those who usually get news from just one or two platforms.
Those who currently pay for news would miss the paper more. Close to half of those who currently pay for local news (43%) say loss of their paper would have a major impact on their ability to keep up with what is happening in their communities (not surprising as most who currently pay are paying for their local paper). Still, one in five of those who pay for local news (21%) say that losing their local newspaper would have no impact on their ability to keep up with local news and information.
How about those early mobile adapters? They would be far less bothered. Fully 42% said losing their local paper would have no impact on their ability to keep up with community news, and a third more said they the impact would be just minor.
Who pays for local news?
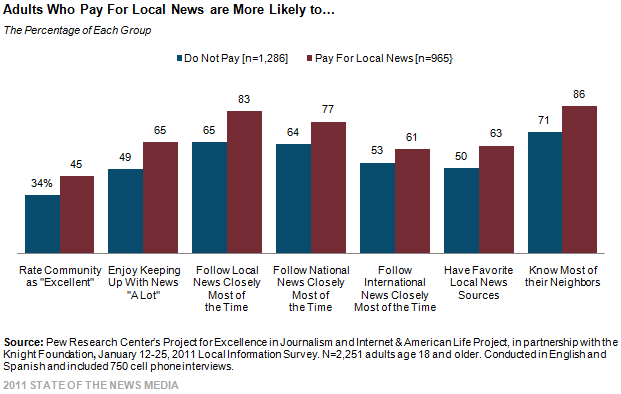
Who make up the people who currently pay for local news in some form or another? They are different from others in their community in some important ways. They are more likely than nonpayers to rate their community as excellent and to know their neighbors. They are also more likely to enjoy keeping up with news generally and to follow all kinds of news, including international and national news, closely most of the time. And while they are more likely to use a wider variety of news sources (40% use six or more on a regular basis, compared with 32% of other adults), they are also more likely to have a favorite local news source.
Demographically, they are disproportionately white, female and older, and have higher household incomes and higher levels of educational attainment, and are more likely to be longtime community residents when compared with those who do not currently pay. Paying for local news is also much more common among adults who live in suburban or rural communities than among those who live in urban centers. These differences are almost entirely a reflection of the differences between who does, and does not, subscribe to their local newspaper.
Methodology
This report is based on the findings of a survey on Americans’ use of the internet. The results in this report are based on data from telephone interviews conducted by Princeton Survey Research Associates International from Jan. 12 to 25, 2011, among a sample of 2,251 adults, age 18 and older. Telephone interviews were conducted in English and Spanish by landline (1,501) and cellphone (750, including 332 without a landline phone). For results based on the total sample, one can say with 95% confidence that the error attributable to sampling is plus or minus 2.4 percentage points. For results based Internet users (n=1,762), the margin of sampling error is plus or minus 2.7 percentage points. In addition to sampling error, question wording and practical difficulties in conducting telephone surveys may introduce some error or bias into the findings of opinion polls.
A combination of landline and cellphone random digit dial (RDD) samples was used to represent all adults in the continental United States who have access to either a landline or cellphone. Both samples were provided by Survey Sampling International, LLC (SSI) according to PSRAI specifications. Numbers for the landline sample were selected with probabilities in proportion to their share of listed telephone households from active blocks (area code + exchange + two-digit block number) that contained three or more residential directory listings. The cellphone sample was not list-assisted, but was drawn through a systematic sampling from dedicated wireless 100-blocks and shared service 100-blocks with no directory-listed landline numbers.
New sample was released daily and was kept in the field for at least five days. The sample was released in replicates, which are representative subsamples of the larger population. This ensures that complete call procedures were followed for the entire sample. At least seven attempts were made to complete an interview at a sampled telephone number. The calls were staggered over times of day and days of the week to maximize the chances of making contact with a potential respondent. Each number received at least one daytime call in an attempt to find someone available. For the landline sample, interviewers asked to speak with the youngest adult male or female currently at home based on a random rotation. If no male/female was available, interviewers asked to speak with the youngest adult of the other gender. For the cellphone sample, interviews were conducted with the person who answered the phone. Interviewers verified that the person was an adult and in a safe place before administering the survey. Cellphone sample respondents were offered a post-paid cash incentive for their participation. All interviews completed on any given day were considered to be the final sample for that day.
Weighting is generally used in survey analysis to compensate for sample designs and patterns of nonresponse that might bias results. A two-stage weighting procedure was used to weight this dual-frame sample. The first-stage weight is the product of two adjustments made to the data – a Probability of Selection Adjustment (PSA) and a Phone Use Adjustment (PUA). The PSA corrects for the fact that respondents in the landline sample have different probabilities of being sampled depending on how many adults live in the household. The PUA corrects for the overlapping landline and cellular sample frames.
The second stage of weighting balances sample demographics to population parameters. The sample is balanced by form to match national population parameters for sex, age, education, race, Hispanic origin, region (U.S. Census definitions), population density and telephone usage. The white, non-Hispanic subgroup is also balanced on age, education and region. The basic weighting parameters came from a special analysis of the Census Bureau’s 2010 Annual Social and Economic Supplement (ASEC) that included all households in the continental United States. The population density parameter was derived from Census 2000 data. The cellphone usage parameter came from an analysis of the January-June 2010 National Health Interview Survey.1
Following is the full disposition of all sampled telephone numbers:
|
Table 2: Sample Disposition |
||
|
Landline |
Cellphone |
|
|
29,846 |
13,498 |
Total Numbers Dialed |
|
1,365 |
270 |
Nonresidential |
|
1,425 |
28 |
Computer/Fax |
|
2 |
—- |
Cellphone |
|
13,829 |
4,988 |
Other not working |
|
1,664 |
152 |
Additional projected not working |
|
11,561 |
8,060 |
Working numbers |
|
38.7% |
59.7% |
Working Rate |
|
555 |
51 |
No Answer/Busy |
|
2,815 |
1,943 |
Voice Mail |
|
60 |
11 |
Other Non-Contact |
|
8,131 |
6,055 |
Contacted numbers |
|
70.3% |
75.1% |
Contact Rate |
|
514 |
780 |
Callback |
|
6,018 |
3,995 |
Refusal |
|
1,599 |
1,280 |
Cooperating numbers |
|
19.7% |
21.1% |
Cooperation Rate |
|
53 |
36 |
Language Barrier |
|
—- |
478 |
Child’s cellphone |
|
1,546 |
766 |
Eligible numbers |
|
96.7% |
59.8% |
Eligibility Rate |
|
45 |
16 |
Break-off |
|
1,501 |
750 |
Completes |
|
97.1% |
97.9% |
Completion Rate |
|
13.4% |
15.5% |
Response Rate |
The disposition reports all of the sampled telephone numbers ever dialed from the original telephone number samples. The response rate estimates the fraction of all eligible respondents in the sample that were ultimately interviewed. At PSRAI it is calculated by taking the product of three component rates:
Contact rate – the proportion of working numbers where a request for interview was made
Cooperation rate – the proportion of contacted numbers where a consent for interview was at least initially obtained, versus those refused
Completion rate – the proportion of initially cooperating and eligible interviews that were completed
Thus the response rate for the landline sample was 13.4 percent. The response rate for the cellphone sample was 15.5 percent.


