The analysis in this report is based on a self-administered web survey conducted from Sept. 26 to Oct. 23, 2023, among a sample of 1,453 dyads, with each dyad (or pair) comprised of one U.S. teen ages 13 to 17 and one parent per teen. The margin of sampling error for the full sample of 1,453 teens is plus or minus 3.2 percentage points. The margin of sampling error for the full sample of 1,453 parents is plus or minus 3.2 percentage points. The survey was conducted by Ipsos Public Affairs in English and Spanish using KnowledgePanel, its nationally representative online research panel.
The research plan for this project was submitted to an external institutional review board (IRB), Advarra, which is an independent committee of experts that specializes in helping to protect the rights of research participants. The IRB thoroughly vetted this research before data collection began. Due the risks associated with surveying minors, this research underwent a full board review and received approval (Approval ID Pro00073203).
KnowledgePanel members are recruited through probability sampling methods and include both those with internet access and those who did not have internet access at the time of their recruitment. KnowledgePanel provides internet access for those who do not have it and, if needed, a device to access the internet when they join the panel. KnowledgePanel’s recruitment process was originally based exclusively on a national random-digit-dialing (RDD) sampling methodology. In 2009, Ipsos migrated to an address-based sampling (ABS) recruitment methodology via the U.S. Postal Service’s Delivery Sequence File (DSF). The DSF has been estimated to cover as much as 98% of the population, although some studies suggest that the coverage could be in the low 90% range.4
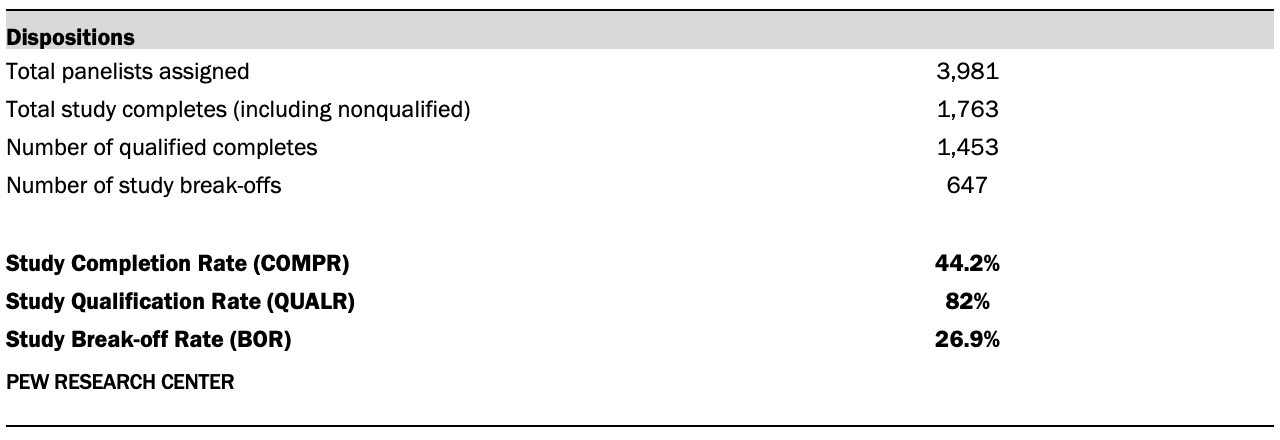
Panelists were eligible for participation in this survey if they indicated on an earlier profile survey that they were the parent of a teen ages 13 to 17. A random sample of 3,981 eligible panel members were invited to participate in the study. Responding parents were screened and considered qualified for the study if they reconfirmed that they were the parent of at least one child ages 13 to 17 and granted permission for their teen who was chosen to participate in the study. In households with more than one eligible teen, parents were asked to think about one randomly selected teen and that teen was instructed to complete the teen portion of the survey. A survey was considered complete if both the parent and selected teen completed their portions of the questionnaire, or if the parent did not qualify during the initial screening.
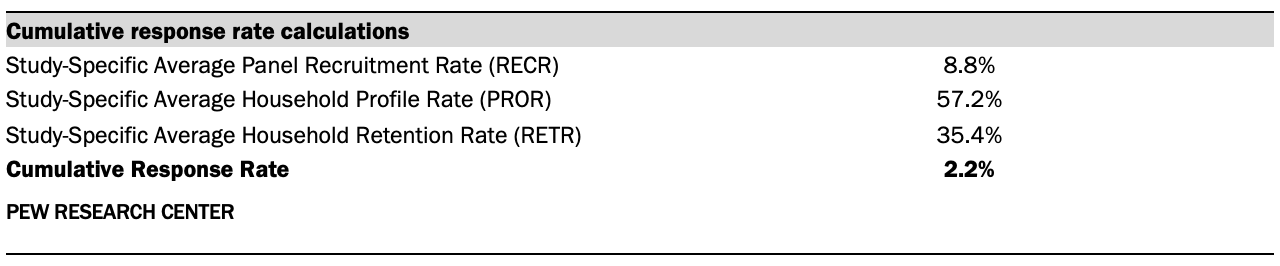
Of the sampled panelists, 1,763 (excluding break-offs) responded to the invitation and 1,453 qualified, completed the parent portion of the survey, and had their selected teen complete the teen portion of the survey yielding a final stage completion rate of 44% and a qualification rate of 82%. The cumulative response rate accounting for nonresponse to the recruitment surveys and attrition is 2.2%. The break-off rate among those who logged on to the survey (regardless of whether they completed any items or qualified for the study) is 26.9%.
Upon completion, qualified respondents received a cash-equivalent incentive worth $10 for completing the survey. To encourage response from non-Hispanic Black panelists, the incentive was increased from $10 to $20 on Oct. 5, 2023. The incentive was increased again on Oct. 10, 2023, from $20 to $40; then to $50 on Oct. 17, 2023; and to $75 on Oct. 20, 2023. Reminders and notifications of the change in incentive were sent for each increase.
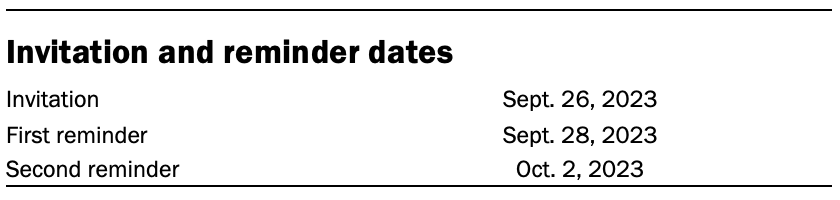
All panelists received email invitations and any nonresponders received reminders, shown in the table. The field period was closed on Oct. 23, 2023.
Weighting
The analysis in this report was performed using separate weights for parents and teens. The parent weight was created in a multistep process that begins with a base design weight for the parent, which is computed to reflect their probability of selection for recruitment into the KnowledgePanel. These selection probabilities were then adjusted to account for the probability of selection for this survey which included oversamples of Black and Hispanic parents.
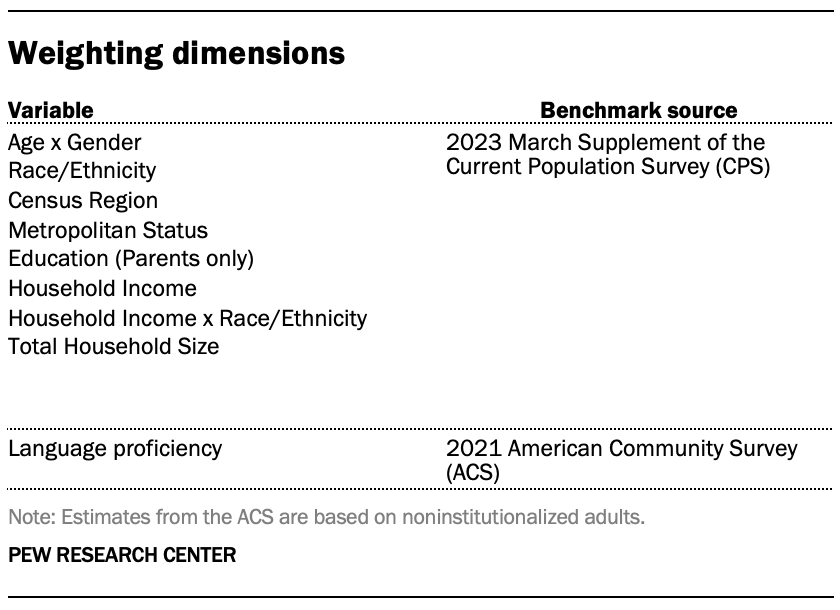
Next, an iterative technique was used to align the parent design weights to population benchmarks for parents of teens ages 13 to 17 on the dimensions identified in the accompanying table, to account for any differential nonresponse that may have occurred.
To create the teen weight, an adjustment factor was applied to the final parent weight to reflect the selection of one teen per household. Finally, the teen weights were further raked to match the demographic distribution for teens ages 13 to 17 who live with parents. The teen weights were adjusted on the same teen dimensions as parent dimensions with the exception of teen education, which was not used in the teen weighting.
Sampling errors and tests of statistical significance take into account the effect of weighting. Interviews were conducted in both English and Spanish.
In addition to sampling error, one should bear in mind that question wording and practical difficulties in conducting surveys can introduce error or bias into the findings of opinion polls.
The following tables show the unweighted sample sizes and the error attributable to sampling that would be expected at the 95% level of confidence for different groups in the survey:
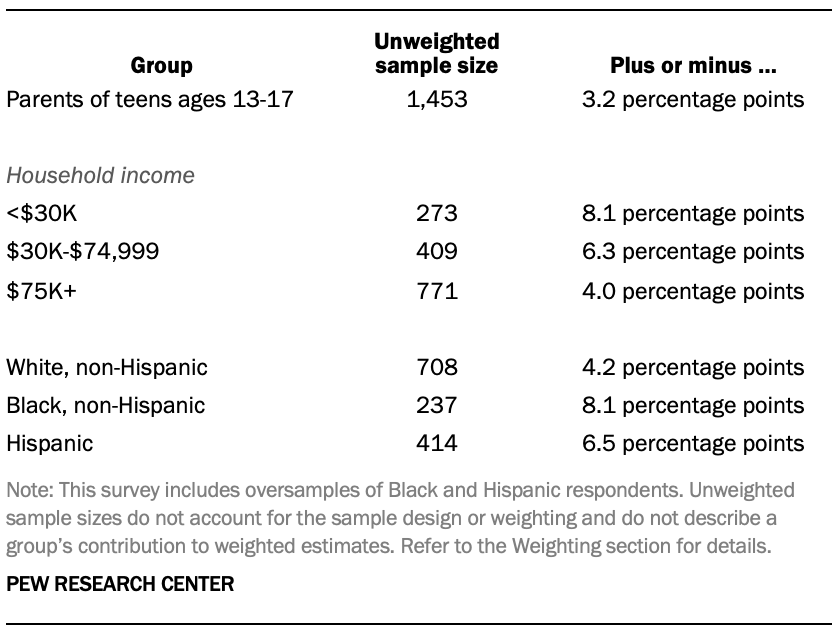
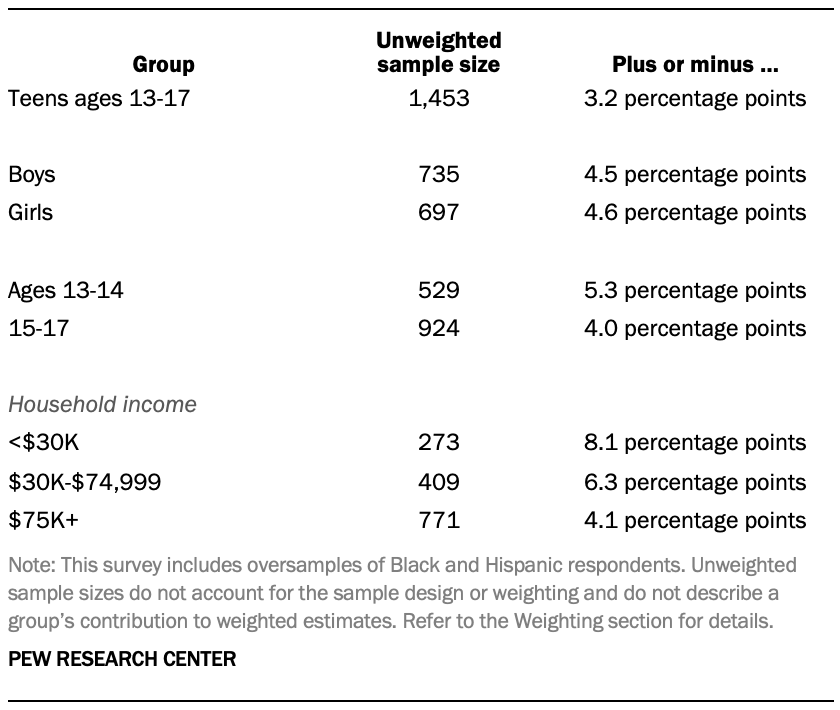
Sample sizes and sampling errors for subgroups are available upon request.
Dispositions and response rates
The tables below display dispositions used in the calculation of completion, qualification and cumulative response rates.5
© Pew Research Center, 2023