
The American Trends Panel survey methodology
Overview
The American Trends Panel (ATP), created by Pew Research Center, is a nationally representative panel of randomly selected U.S. adults. Panelists participate via self-administered web surveys. Panelists who do not have internet access at home are provided with a tablet and wireless internet connection. Interviews are conducted in both English and Spanish. The panel is being managed by Ipsos.
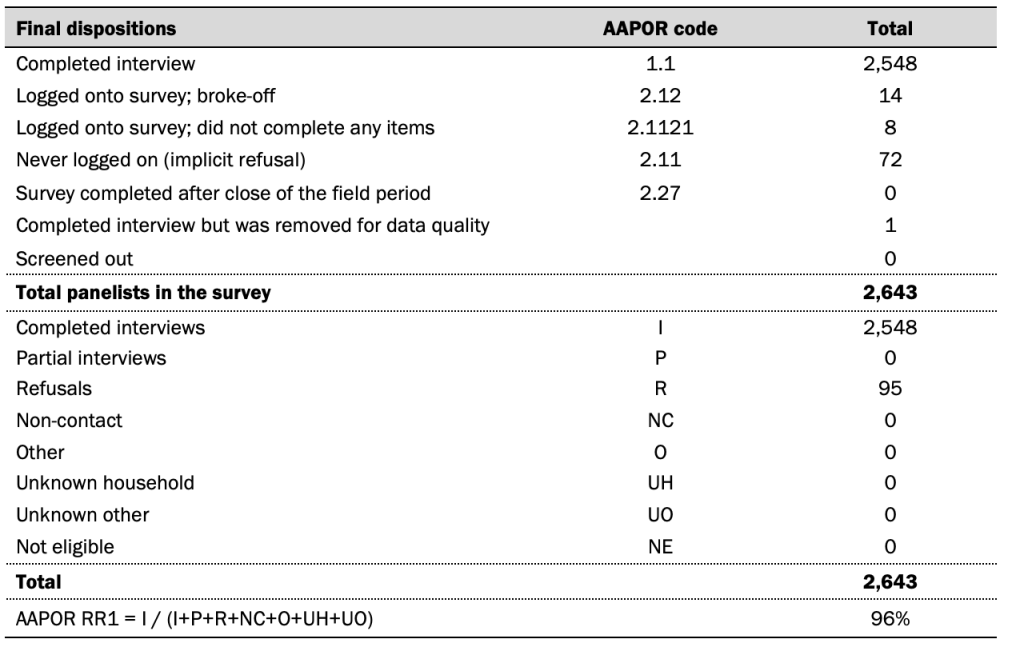
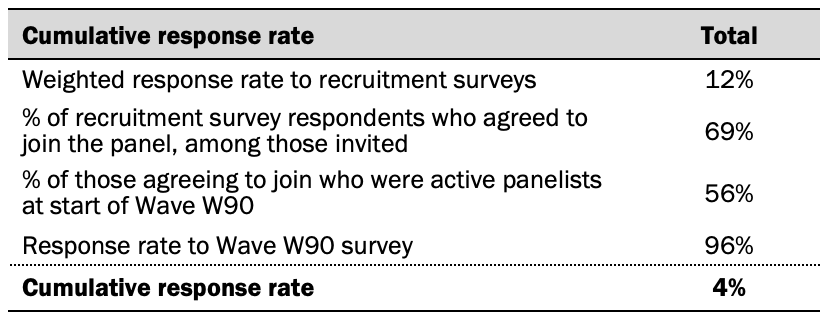
Data in this report is drawn from the panel wave conducted May 17 to May 31, 2021. The sample is comprised of panelists who indicated that they use Twitter on the Wave 85 survey conducted on the ATP in March 2021. A total of 2,548 panelists responded out of 2,643 who were sampled, for a response rate of 96%. The cumulative response rate accounting for nonresponse to the recruitment surveys and attrition is 4%. The break-off rate among panelists who logged on to the survey and completed at least one item is less than 1%. The margin of sampling error for the full sample of 2,548 respondents is plus or minus 3.4 percentage points.
Panel recruitment
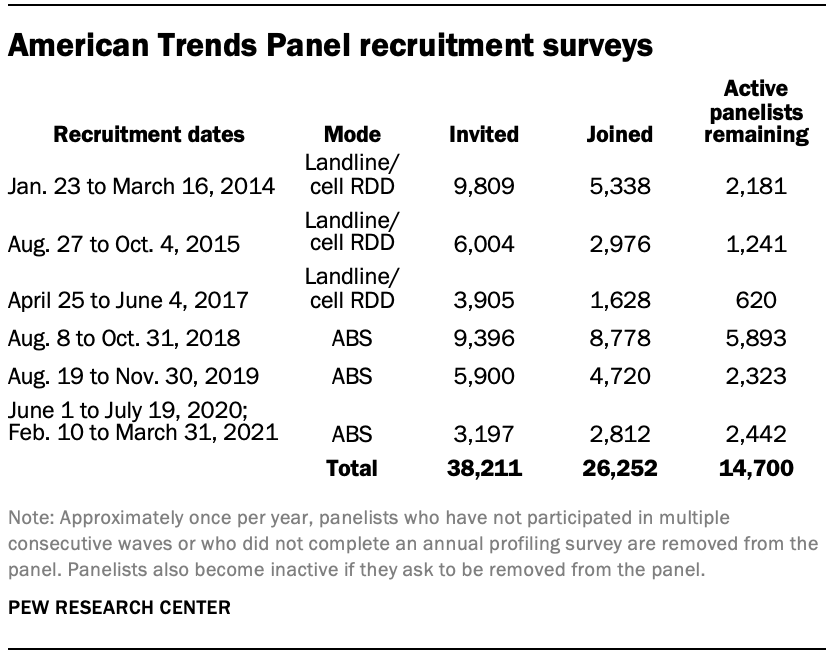
The ATP was created in 2014, with the first cohort of panelists invited to join the panel at the end of a large, national, landline and cellphone random-digit-dial survey that was conducted in both English and Spanish. Two additional recruitments were conducted using the same method in 2015 and 2017, respectively. Across these three surveys, a total of 19,718 adults were invited to join the ATP, of whom 9,942 (50%) agreed to participate.
In August 2018, the ATP switched from telephone to address-based recruitment. Invitations were sent to a random, address-based sample of households selected from the U.S. Postal Service’s Delivery Sequence File. Two additional recruitments were conducted using the same method in 2019 and 2020, respectively. Across these three address-based recruitments, a total of 18,493 adults were invited to join the ATP, of whom 16,310 (88%) agreed to join the panel and completed an initial profile survey. In each household, the adult with the next birthday was asked to go online to complete a survey, at the end of which they were invited to join the panel. Of the 26,252 individuals who have ever joined the ATP, 14,700 remained active panelists and continued to receive survey invitations at the time this survey was conducted.
The U.S. Postal Service’s Delivery Sequence File has been estimated to cover as much as 98% of the population, although some studies suggest that the coverage could be in the low 90% range.2 The American Trends Panel never uses breakout routers or chains that direct respondents to additional surveys.
Sample design
The overall target population for this survey was Twitter users ages 18 and older, living in the U.S., including Alaska and Hawaii. The sample consisted of 2,643 panelists who indicated that they use Twitter on the Wave 85 survey conducted on the ATP in March 2021.
Questionnaire development and testing
The questionnaire was developed by Pew Research Center in consultation with Ipsos. The web program was rigorously tested on both PC and mobile devices by the Ipsos project management team and Pew Research Center researchers. The Ipsos project management team also populated test data which was analyzed in SPSS to ensure the logic and randomizations were working as intended before launching the survey.
Incentives
All respondents were offered a post-paid incentive for their participation. Respondents could choose to receive the post-paid incentive in the form of a check or a gift code to Amazon.com or could choose to decline the incentive. Incentive amounts ranged from $5 to $20 depending on whether the respondent belongs to a part of the population that is harder or easier to reach. Differential incentive amounts were designed to increase panel survey participation among groups that traditionally have low survey response propensities.
Data collection protocol
The data collection field period for this survey was May 17 to May 31, 2021. Postcard notifications were mailed to all ATP panelists with a known residential address on May 17, 2021.
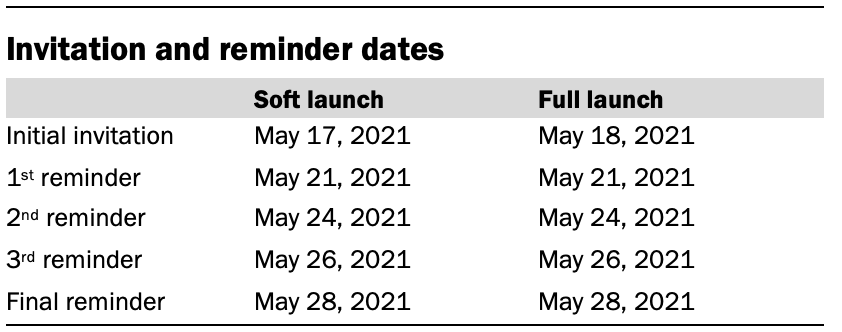
Invitations were sent out in two separate launches: Soft launch and full launch. Sixty panelists were included in the soft launch, which began with an initial invitation sent on May 17, 2021. The ATP panelists chosen for the initial soft launch were known responders who had completed previous ATP surveys within one day of receiving their invitation. All remaining English- and Spanish-speaking panelists were included in the full launch and were sent an invitation on May 18, 2021.
All panelists with an email address received an email invitation and up to four email reminders if they did not respond to the survey. All ATP panelists that consented to SMS messages received an SMS invitation and up to four SMS reminders.
Data quality checks
To ensure high-quality data, the Center’s researchers performed data quality checks to identify any respondents showing clear patterns of satisficing. This includes checking for very high rates of leaving questions blank, as well as always selecting the first or last answer presented. As a result of this checking, 1 ATP respondent was removed from the survey dataset prior to weighting and analysis.
Weighting
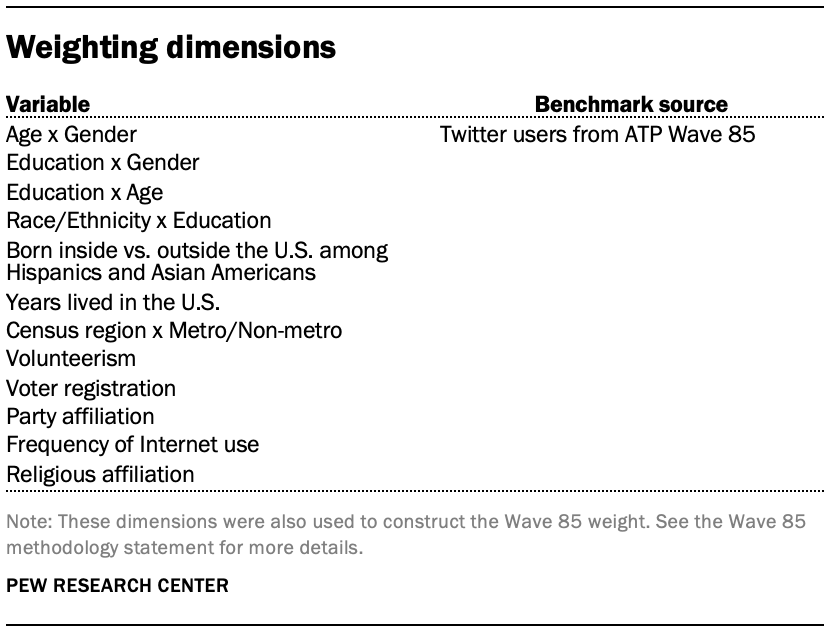
The ATP data was weighted in a multistep process that accounts for multiple stages of sampling and nonresponse that occur at different points in the survey process. First, each panelist begins with a base weight that reflects their probability of selection for their initial recruitment survey (and the probability of being invited to participate in the panel in cases where only a subsample of respondents were invited). The base weights for panelists recruited in different years are scaled to be proportionate to the effective sample size for all active panelists in their cohort. To correct for nonresponse to the initial recruitment surveys and gradual panel attrition, the base weights for all active panelists are calibrated to align with the population benchmarks identified in the accompanying table to create a full-panel weight.
For ATP waves in which only a subsample of panelists are invited to participate, a wave-specific base weight is created by adjusting the full-panel weights for subsampled panelists to account for any differential probabilities of selection for the particular panel wave. For waves in which all active panelists are invited to participate, the wave-specific base weight is identical to the full-panel weight.
In the final weighting step, the wave-specific base weights for panelists who completed the survey are again calibrated to match the population benchmarks specified above. These weights are trimmed (typically at about the 1st and 99th percentiles) to reduce the loss in precision stemming from variance in the weights. Sampling errors and test of statistical significance take into account the effect of weighting.
For this wave, the sample was weighted to align with benchmarks that were estimated among all Twitter users who responded to Wave 85.
The following table shows the unweighted sample sizes and the error attributable to sampling that would be expected at the 95% level of confidence for different groups in the survey.
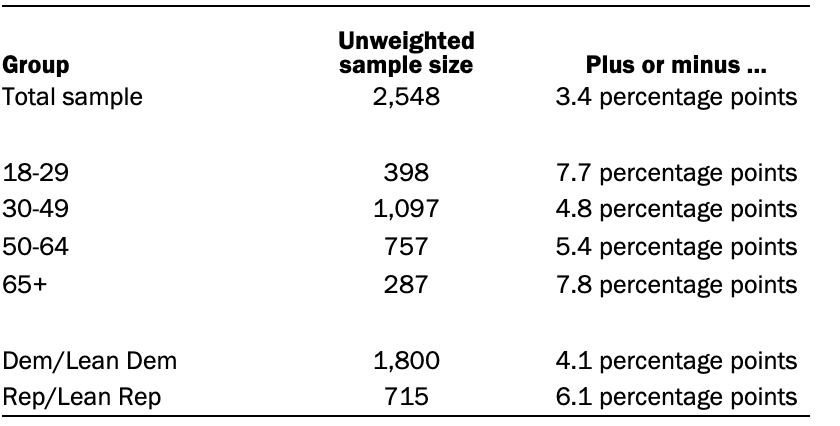
Sample sizes and sampling errors for other subgroups are available upon request. In addition to sampling error, one should bear in mind that question wording and practical difficulties in conducting surveys can introduce error or bias into the findings of opinion polls.
Dispositions and response rates
Analysis of Twitter behavioral data
The analysis of Twitter users’ behaviors and activities on the site is based on a subsample of 1,026 respondents to the main survey who had previously agreed to share their Twitter handle for research purposes and provided a valid handle. Researchers from the Center used these handles to collect information about their on-site behaviors using the Twitter API.
The handles for these respondents were initially collected in a previous wave of the ATP fielded March 8 to March 14, 2021. These respondents were then included in the subsequent survey of all Twitter users that the main analysis in this report is based on.
Of the 2,548 adults who completed this survey, 1,099 (43%) had previously agreed to provide their Twitter handle. After the survey was fielded, researchers reviewed each account individually and removed any accounts that were suspended, invalid, or that belonged to institutions, products or international entities. The analysis of Twitter behavioral data in this report is based on the 1,026 respondents who both completed the survey and provided a valid, active handle.
This final sample of 1,026 U.S. adult Twitter users with valid, active handles was weighted using an iterative technique that matches gender, age, race, place of birth among Hispanics and Asian Americans, years lived in the U.S., education, region, party identification, volunteerism, voter registration, and metropolitan area to American Trends Panel March 2021 (Wave 85) survey respondents who indicated in that survey that they use Twitter. The margin of error for the full sample is plus or minus 6 percentage points.
How this report defines the highly active Twitter users and high-volume tweeters
This report uses two different analytic approaches to evaluate the behaviors and attitudes of Twitter users based on tweet volume.
The findings in this report that examine on-site behaviors – such as the share of tweets produced by different proportions of users, or the number of followers people have on the site – are based on tweets produced by respondents with public accounts during the time period of June 12, 2021, to Sept. 12, 2021. These users are grouped into categories based on the average number of tweets they produced each month over the three-month tweet collection period.
Findings in which respondents’ activities on Twitter are matched directly with their survey responses are based on Twitter account metadata obtained through the Twitter API. For any valid account (including those set to private) the Twitter API provides basic summary information such as the age of the account and total number of tweets over the life of the account. Researchers used these metadata figures to categorize respondents based on the average number of tweets per month they have produced over the total amount of time their account has been active.
Question wording and respondent consent language for collection of Twitter handles
Respondents were asked to provide their Twitter handles for research purposes using the following language:
In many of our surveys, we ask about how people like you use social media. But there’s a lot we cannot learn unless you allow us to connect information about your public Twitter behavior to your answers.
No matter how often you use Twitter, would you be willing to share your Twitter handle to help us with this research?
- 1 Yes
- 2 No
This project will ONLY collect information that an ordinary user would see when they visit your profile. We will treat this data just like we treat your survey responses and will NEVER share anything that can be linked back to you.
How we will use your Twitter handle
If you provide us with your Twitter handle, we will only be able to collect what an ordinary user would see when visiting your profile. The specific information we will have access to depends on the privacy settings of your Twitter account.
If your account is set to PUBLIC, we will be able to see the accounts you follow; the accounts that follow you; the text of any tweets you have posted; and basic information in your profile, such as your description and the age of your account. We will NOT have access to any private messages you have sent or received.
If your account is set to PRIVATE, we will be able to see how many accounts you follow or how many times you have tweeted – but will NOT be able to see any private messages you have sent or received; the actual content of your tweets; or the names of the accounts you follow or that follow you.
We expect that this research will be concluded in approximately 18 months. At that point we will ask you again whether or not you would like to provide your handle. If you provided your Twitter handle to us previously, that is why you are seeing this question again.
If at any point you wish to opt out of research related to your Twitter account, contact info@americantrendspanel.org. For more information about our privacy practices, please see our Privacy Policy.


