About this report
This report is based on the findings of a daily tracking survey on Americans’ use of the Internet. The results in this report are based on data from telephone interviews conducted by Princeton Survey Research Associates International between April 29 and May 30, 2010, among a sample of 2,252 adults, age 18 and older. Interviews were conducted in English. For results based on the total sample, one can say with 95% confidence that the error attributable to sampling and other random effects is plus or minus 2.4 percentage points. For results based Internet users (n=1,756), the margin of sampling error is plus or minus 2.7 percentage points. In addition to sampling error, question wording and practical difficulties in conducting telephone surveys may introduce some error or bias into the findings of opinion polls.
A combination of landline and cellular random digit dial (RDD) samples was used to represent all adults in the continental United States who have access to either a landline or cellular telephone. Both samples were provided by Survey Sampling International, LLC (SSI) according to PSRAI specifications. Numbers for the landline sample were selected with probabilities in proportion to their share of listed telephone households from active blocks (area code + exchange + two-digit block number) that contained three or more residential directory listings. The cellular sample was not list-assisted, but was drawn through a systematic sampling from dedicated wireless 100-blocks and shared service 100-blocks with no directory-listed landline numbers.
New sample was released daily and was kept in the field for at least five days. The sample was released in replicates, which are representative subsamples of the larger population. This ensures that complete call procedures were followed for the entire sample. At least 7 attempts were made to complete an interview at a sampled telephone number. The calls were staggered over times of day and days of the week to maximize the chances of making contact with a potential respondent. Each number received at least one daytime call in an attempt to find someone available. For the landline sample, half of the time interviewers first asked to speak with the youngest adult male currently at home. If no male was at home at the time of the call, interviewers asked to speak with the youngest adult female. For the other half of the contacts interviewers first asked to speak with the youngest adult female currently at home. If no female was available, interviewers asked to speak with the youngest adult male at home. For the cellular sample, interviews were conducted with the person who answered the phone. Interviewers verified that the person was an adult and in a safe place before administering the survey. Cellular sample respondents were offered a post-paid cash incentive for their participation. All interviews completed on any given day were considered to be the final sample for that day.
Non-response in telephone interviews produces some known biases in survey-derived estimates because participation tends to vary for different subgroups of the population, and these subgroups are likely to vary also on questions of substantive interest. In order to compensate for these known biases, the sample data are weighted in analysis. The demographic weighting parameters are derived from a special analysis of the most recently available Census Bureau.
Following is the full disposition of all sampled telephone numbers:
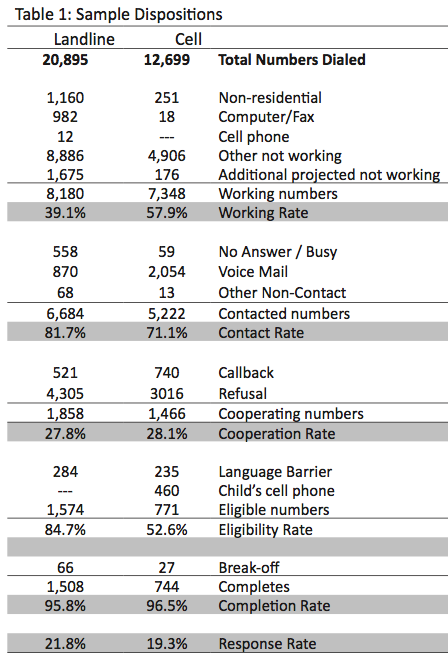
The disposition reports all of the sampled telephone numbers ever dialed from the original telephone number samples. The response rate estimates the fraction of all eligible respondents in the sample that were ultimately interviewed. At PSRAI it is calculated by taking the product of three component rates:
- Contact rate
- Cooperation rate
- Completion rate
Thus the response rate for the landline sample was 21.8 percent. The response rate for the cellular sample was 19.3 percent.


