Connected but Hassled: Many in this group have invested in a lot of technology, but the connectivity is a hassle for them.
This group of older technology users in many ways represents the average when it comes to consumption of information goods and services. However, when focusing on use of information technology and attitudes about it, the Connected but Hassled are decidedly unenthusiastic about the hardware and services they have acquired.
Assets
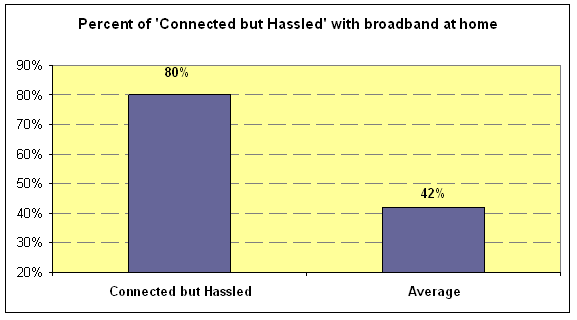
In our sample, all members of this group are internet users, 88% have desktop computers, and most (80%) have high-speed connections at home. For information appliances that might serve as an on-ramp to deeper online and mobile activities, the Connected but Hassled are reliably near the average. Three-quarters (80%) have cell phones, but they tend not to have many features on them such as taking pictures or surfing the internet. One-third (32%) have laptop computers, just above the average, but few have PDAs (7%) and just 8% have web cams.

Activities
Whereas Connected but Hassled are more likely than average to have broadband at home, they are no more likely than average to go online on the typical day, and much less likely to have done any of the high-end online activities about which the survey asked. Some 66% of the Connected but Hassled say they go online on the average day and 24% and 33% say they use the internet several times a day from home or work, respectively. Each of those figures is just below the average.
Just 18% of the Connected but Hassled like that information gadgets make them more available to others.
Although some 18% of the Connected but Hassled will go online just for fun on the typical day (against the 28% average), very few download music, pay for online content, or use the wireless internet. And just 24% have done anything pertaining to user-generated content. Only 19% have ever sent or received a text message and 9% has watched TV on a device other than their home television. The group’s disinterest in the advanced technologies and activities queried in this survey, combined with average-level online activity, suggests this group probably sticks to the basics when online – checking email, perhaps some news headlines.
Attitudes
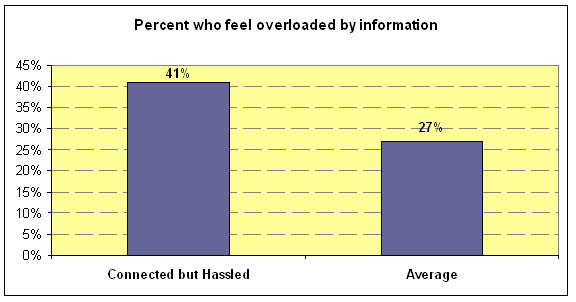
Information technology is anywhere from a burden to an irrelevance for the Connected but Hassled. Four in ten (41%) say they feel overloaded by information – half again more than the average for all Americans (27%). A greater number (52%) thinks information technology gives them less control of makes no difference in their lives, above the average of 45%. And 26% find dealing with their various information appliances to be annoying, which is above the average and twice the rate recorded by Connectors.
Whereas half of all Americans with either a cell phone or internet access like the fact that these items make them more available to others, just 18% of the Connected but Hassled do. And only 9% of members of this group see themselves as more productive due to information technology, less than one third the average of 33%.

The picture is not completely bleak for the Connected but Hassled. Some 48% say information technology helps “a lot” to keep up with family and friends, while 41% say this about information technology’s role in helping them learn new things. These figures are about ten percentage points below the averages for all internet users. But they suggest that, to the extent the Connected but Hassled value information technology, it is for communicating with others and getting information that is personally enriching.
Demographics
The typical member of this group is 46 years old and has been online for about 7 years. She – and 59% of this group are women – is well-educated and above average in terms of household income. The group is predominantly white (80%) and its workforce participation rate matches the national average. Reluctants make up 10% of the general population.


