For more than three centuries, the politics, social structure and economic development of the South have been powerfully shaped by the interplay of whites and blacks. That has begun to change, with the arrival of a third group, Hispanics. Once a sparse presence in the South, Latinos are now a fast-growing and increasingly visible player in the region’s demographic drama. Their rapid growth from a small base constitutes a distinct demographic phenomenon that differs in important ways from the slower buildup of larger Hispanic populations evident in places like California and Texas. And it is not occurring uniformly across the South. Rather, it is most concentrated in a few states and in particular in a few dozen counties within those states. By highlighting the nature of population change in parts of the South where the Latino numbers are growing fastest, this report sets out to illuminate the mechanisms that underlie that change and the demographic trajectories they produce.
Several features distinguish the kind of Hispanic population growth taking place in the new settlement areas of the South: its speed, its relation to the growth of other population groups and the characteristics of the Latinos settling there. In the six Southern states with the fastest Latino growth, the Hispanic population quadrupled between 1990 and 2000. That rapid growth reflects the fact that the Latino numbers started quite small, but it represents an extraordinarily quick demographic change nonetheless. And Latinos are not the only group that is growing. In most areas of the South experiencing very rapid Latino growth from a very small base, the numbers of whites and blacks are also increasing, albeit at slower rates. That is not the case in many other parts of the country, where the non-Hispanic populations are static or declining. Finally, the Latino population added to the new settlement areas of the South is younger, more immigrant and more male than the Hispanic population overall. This has all the characteristics of labor migration in its early stages.
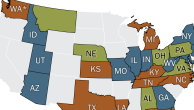
As noted above, this analysis focuses on areas of the South that are experiencing rapid growth of the Hispanic population from a small base, and that necessarily involved excluding other parts of the region. Two Southern states, Texas and Florida, have large Hispanic populations of long tenure and thus do not fit the definition of places where the Hispanic population was small until a process of rapid growth got underway in recent years. Six states were selected for study because the Hispanic growth rates in these states ranked among the highest of any states in the nation from 1990 to 2000. The increases in Arkansas, Georgia and North Carolina topped 300 percent in that decade, while Georgia, Tennessee and South Carolina all rose by more than 200 percent. Elsewhere in the nation, only Nevada registered growth of more than 200 percent (Map 1 and Table 1). Two other Southern states Kentucky (173%) and Virginia (106%) had substantial Hispanic growth but below the 200 percent mark chosen as the threshold for this study. And, Louisiana had very little growth in its Latino population, just 16 percent.


To better understand the diversity of both demographic and economic growth patterns at a local level, this analysis also focuses on 36 counties in the South. All are within the six states except for DeSoto County, Miss., which forms part of the Memphis, Tenn., metropolitan area. The selection criteria for the 36 counties, which are described in Appendix 1, provided for a mix of counties with small, medium and large populations in rural, metropolitan and urban settings where relatively few Hispanics lived prior to 1990 and which then experienced very rapid Latino growth. About half (51%) of the Hispanic population in the six states lived in these counties as of 2000, and they were the scene of a little more than half (56%) of all the Hispanic growth since 1990.

Finally, to draw contrasts, this report also examines four states—California, Illinois, New Jersey and New York—that are also experiencing Hispanic population growth but from a substantial base. These traditional settlement areas are different from new settlement areas because of the size and tenure of their Latino populations, but as this analysis reveals there are also several other important differences in the dynamics of population change.
Speed
The 2000 census reported that the Hispanic population had grown by 58 percent nationwide in the previous decade, but that very substantial growth rate masked major differences at the regional, state and local levels. The six Southern states studied here had a Latino population of about 293,000 in 1990 (Table 2). By 2000 that figure had quadrupled to nearly 1.2 million. Even at a time of extraordinary overall growth in the U.S. Latino population, this part of the South registered phenomenal increases over a relatively short time frame.
During the 1990s the Latino population of these six states increased by an average of 308 percent, and each ranked among the states with the fastest growth rates in the nation, as noted above. These exceptionally high growth rates are a function of two factors: the relatively small Latino populations present when the growth began and the speed of the growth once it did so.
To keep this phenomenon in perspective it is important to note that in terms of absolute numbers the growth of the Latino population in the new settlement areas of the South was quite modest. The six states with a growth rate of 308 percent added just a bit more than 900,000 Hispanics to their populations. Meanwhile, New York and New Jersey alone, with a combined Hispanic growth rate of 35 percent, together added more than a million Hispanics to their populations, and California, growing from a very large base, had a growth rate below the national average but still added nearly 3.3 million Latinos to its population (Table 2).
Speed—not sheer size—defines Latino population growth in the six Southern states, and speed in this case means very fast increases from a very small base.

In the counties where most of the growth took place, the pace was even faster. The 36 counties examined here experienced increases in their Hispanic populations averaging 462 percent between 1990 and 2000, and 26 of them registered increases of more than 500 percent (Appendix 1). The highly concentrated growth at the local level occurred in a variety of settings. Gordon County, Ga., for example, had a total of some 44,000 mostly rural residents in 2000. But it sits astride Interstate 75 roughly midway between Atlanta and Chattanooga, Tenn., and it has a fast-growing manufacturing sector, especially in carpets and other floor-covering materials. In 1990 there were only 200 Latinos in the county, but by 2000 the Hispanic population had grown 16-fold to more than 3,200. Mecklenburg County, N.C., by contrast, includes the city of Charlotte and was home to nearly 700,000 people in 2000. Its Hispanic population increased from less than 7,000 in 1990 to nearly 45,000 in 2000, a growth rate of 570 percent.
Because those growth rates departed from such a small base, it is unlikely they could have been sustained. Indeed, Census Bureau estimates of population change since the 2000 census show that the pace of Latino growth slowed to 22 percent between 2000 and 2003 in these six Southern states (Table 4). However, compared with the nation as a whole these states continue to experience a much higher pace of Latino growth. The Hispanic population is estimated to have grown by 13 percent nationwide during those three years. Thus, unusual speed remains a key characteristic of Latino growth in the new settlement states although now those increases are coming on a more substantial base.


Context
Aside from its speed, Hispanic population growth in these six states is distinctive because it occurred against a backdrop of simultaneous growth in the rest of the population. In other words, although Latinos are a rapidly growing presence in these six states, they are only one factor in an overall pattern of population growth, and in fact they are a relatively small factor in the broader picture. Both whites and blacks contributed greater numbers to the total population increase in these six Southern states, and this trend has held steady since at least 1990. These states are drawing not just Latinos but others as well, and very fast Hispanic population growth is for the most part happening in places where the whole population is growing robustly.2
The total population of these six Southern states grew by nearly 5.2 million between 1990 and 2000, and Hispanics made up only about 900,000 or 17 percent of that increase (Table 5). Meanwhile, growth in the white population (2.3 million) accounted for 45 percent of the total increase and added numbers of blacks (1.3 million) accounted for 26 percent. Thus, even if not one Latino had been added to the population of this region, it still would have experienced notable growth.
This picture of rapid Latino growth amid overall growth distinguishes these Southern states both from the nation as a whole and from California, New York, New Jersey and Illinois, states that have large, well-established Latino populations.
The overall population of the six Southern states grew by 19 percent between 1990 and 2000 compared with 13 percent in the nation as a whole. Meanwhile, in the four traditional Hispanic settlement states described here, the total population grew by 10 percent (Table 3).
The distinctive growth pattern in these six states is even more apparent when one examines the extent to which different racial and ethnic groups were responsible for population increases. In the nation as a whole, Hispanics accounted for twice as much population growth as whites (40% vs. 20%) while blacks contributed a lesser share (14%). In these six states, as noted above, the roles were reversed; whites were responsible for much more of the growth (45%) than Hispanics (17%) and blacks contributed a sizeable share (26%).
Growth rates tell a similar story. Just as the pace of Hispanic growth in these six states was several times faster than in the nation as a whole (308% vs. 58%), white and black numbers were increasing faster as well (Figure 1). The rate of white population growth in these states was 11 percent, nearly four times as high as the national average of 3 percent. The rate of black population growth was 21 percent in these states compared with 16 percent in the nation.
The contrast is sharpest when comparing these six states with the states that traditionally have had large Hispanic populations. In those places the white population was declining. Taken together, California, New York, New Jersey and Illinois registered a loss of nearly 2.2 million in their white populations, a 5 percent drop. The black population grew more slowly in those four traditional states than in either the nation as a whole (16%) or the six new settlement states (21%). Meanwhile, the number of Latinos in those traditional states grew by 43 percent, which was also below the national average (58%). These traditional settlement states would have experienced net population losses if it had not been for Hispanic growth.
Roughly the same pattern has held true since the 2000 census. In the six Southern states, the white population grew by 2.4 percent between 2000 and 2003, while in the four traditional states it was virtually unchanged, showing an increase of 0.2 percent, according to Census Bureau estimates. Nationally, the white population grew by 1.4 percent over that period. Thus, the region with the fastest Latino growth is also experiencing the fastest white growth.

Characteristics
In addition to its size and context, Latino population growth in the new settlement areas of the South is distinctive because of the characteristics of that population. Simply put, Hispanic growth in these areas is being driven by recent immigration to a greater extent than in the country as a whole or in traditional settlement areas. And, in particular, the growth has come primarily in form of young males from Mexico with comparatively low levels of education. These characteristics are the hallmarks of Mexican labor migration (Durand and Massey, 2004), but the population data from the six Southern states suggest that many of the Hispanic males who went there for work are staying, marrying and having children. As a result, a new element of the Latino population is coming on the scene: a generation of still very young Latinos who are the native-born offspring of immigrant parents.
Nativity
To a much greater extent than in traditional settlement states or in the nation as a whole, immigrants dominate the Latino population in the new settlement areas of the South. In the six states examined here, 57 percent of all Latinos are foreign born, and in the 36 new settlement counties where growth has been particularly intense fully two thirds (66%) of all Hispanics were born outside the United States. In contrast only 41 percent of the Hispanic population nationwide is foreign born. Outside the six new settlement states several factors have produced a larger proportion of native-born Latinos. These include the presence of Hispanics who trace their roots in this country back many generations, such as the Mexican-Americans of Texas and the Southwest, and the existence of large numbers of children born in the United States to immigrants who arrived somewhat earlier.
Period of immigration
About half of the foreign-born Latinos in both the six new settlement states (52%) and the 36 new settlement counties (54%) are relatively recent arrivals—people who had been in the United States for five years or less at the time of the 2000 census (Figure 2). In contrast, recent arrivals made up only about one quarter of Latino foreign-born population (27%) nationwide, and in states with a long history of Hispanic settlement—New York, New Jersey, California and Illinois—recent arrivals accounted for only about one of every five foreign-born Latinos in 2000.
This flow of recent immigrants to new settlements in the South is a large and critical element of a broader change in Latino migration patterns. Considerable evidence now shows that an important share of the migrant streams from Latin America and Mexico began heading to new settlement areas around the country in the 1990s (Passel and Zimmermann, 2001; Singer, 2004). Many Latino newcomers continued to arrive in traditional receiving states. But at an accelerated pace, from the mid-1990s onward, others went to Arizona, Nevada, Oregon, Utah, Nebraska, Iowa and Colorado as well as the six Southern states examined here. It is in the new settlement areas of the South, however, that this demographic pattern of new Latino migration to places where the Hispanic population was previously sparse is both most intense and most widespread across a region.

Age
The foreign-born Latino population is dominated by persons who are of working age, and it is particularly young in the new settlement areas of the South (Figure 3). The median age for foreign-born Latinos in both the six Southern states and the new settlement counties is 27 compared with 33 nationally and 34 in the traditional settlement states. Moreover, Latinos in new settlement states are much younger than whites (median age=37) and blacks (median age=30) residing in these states.
Native-born Latinos are younger than foreign-born Latinos, reflecting the large numbers of children born in the past two decades to immigrant parents. Nationwide, their median age is 18. In traditional settlement states, the median age is 16, and in the six Southern new settlement states it is 15. In some new settlements in the South, virtually all native-born Hispanics are youngsters. In Hall County, Ga., and Randolph County, N.C., for example, the median age of native-born Hispanics is just 5 while in Franklin and Johnston Counties, N.C., it is 4.

Education
The foreign-born Latino population of the new Southern settlement areas has a relatively low level of education. In the six states, 62 percent of adults at least 25 years of age have not finished high school compared with 43 percent nationwide and 39 percent in the four traditional settlement states (Figure 4).
Among the 36 counties studied, Rowan and Alamance counties in North Carolina and Hall County, Ga., had the largest share (82%) of foreign-born Latino adults without a high school diploma.

Educational attainment is notably higher among white and black adults in the new settlements of the South. Compared with the 62 percent of foreign-born Latinos in the six states, only 20 percent of whites and 31 percent of blacks have less than a complete high school education. Conversely, nearly half of all white adults (49%) and more than a third of blacks (38%) have at least some college education, compared with a fifth (20%) of foreign-born Hispanics (Figure 5).

English-language Skills
Not surprisingly given how recently they arrived and how little education they have, large numbers of foreign-born Latinos in new settlement areas do not speak much English. Only 43 percent of all Hispanics in the six new settlement states reported in the 2000 census that they could speak English “well” or “very well” compared with 55 percent nationwide and in the four traditional settlement states. The difference is driven by the larger share of foreign-born in the Latino population of the new settlement states. Among foreign-born Latinos in these states, 54 percent said they speak English “not well” or “not at all.”

Country of Origin
Mexico is the country of origin for more Hispanic immigrants in the United States than all other nations put together, accounting for 64 percent of all Latino immigrants. That dominance is even stronger in the six new settlement states in this study, where those born in Mexico make up 73 percent of foreign-born Latinos (Table 6). Recent data also suggest that some new settlements in the South may be drawing a relatively larger share of migrants from regions of Mexico that have only recently begun sending large numbers of immigrants when compared with the traditional settlement states of California, Illinois, New Jersey and New York.3

Legal Status
Current estimates of the size and characteristics of the unauthorized population show that a substantial share of the Latino foreign born in new settlement states are undocumented (Passel, 2005). Nationally, about 80 percent of the migrants arriving from Mexico since 1995 became unauthorized residents, according to these estimates. North Carolina, with roughly 300,000 undocumented immigrants, now ranks eighth among states with the largest undocumented populations. Estimates put the undocumented population of Georgia between 200,000 and 250,000, of Tennessee between 100,000 and 150,000 and of South Carolina, Arkansas, Alabama and Mississippi between 20,000 and 35,000 per state.
Gender
Across the United States there are somewhat fewer men in the white and black populations than there are women. This reflects the fact that women tend to live longer than men. The phenomenon is measured with a demographic tool called the sex ratio, which compares the number of men per 100 women in a population. The sex ratio nationally is 96 for whites and somewhat lower (90) for blacks, among whom early male mortality is more pronounced. For native-born Hispanics nationally the sex ratio is slightly higher (100) because this is a younger population and earlier male mortality has yet to have had its full effect (Table 6).
New Latino settlements in the South are very different on this score. In the six Southern states, the sex ratio for all Hispanics is 140, and the disproportionate number of males is driven by international migrants. Among foreign-born Latinos in the six states there are 173 men for every 100 women. Four counties—Jefferson County, Ala., Cherokee County, Ga., and Robeson and Mecklenburg Counties in North Carolina—all had at least 200 men for every 100 women.

Unbalanced sex ratios are typically a product of a migration in which men are moving in search of economic opportunity. In the frontier states of the American West, for example, sex ratios were exceptionally high compared with those in the East in the middle of the 19th century. (Stephan, 2005) High ratios of males are evidence of a labor migration among Hispanics today, and this is vividly clear in the new settlement states. It is important to note, however, that nature tends to take its course over time and that sex ratios eventually become balanced. Consider again the example of the American West: Fifty years after experiencing very high sex ratios of the sort now registered among foreign-born Hispanics in the new settlements of the South, the populations of states like California, Wyoming and Colorado were in the normal range.
Marital Status
The young males who are the pioneers of the Latino migration to new settlement states are mostly still living without spouses, although there are signs that some of the newcomers are beginning to form families. On this score, it is useful to differentiate by age. Looking at foreignborn Hispanic men ages 16 to 38, a little more than half (51%) are single and never married in the six Southern states. This is only slightly higher than the share nationally (47%) and in the traditional settlement states (47%). The same pattern holds for men who are somewhat older as well (Table 8).

Another third of the Hispanic foreign-born males in the younger age category (33%) are married and living with their spouses. The national mark is higher (41%) for this group; nationwide, this age group is more settled. And in another sign of how recent the migration has been, 12 percent of the males in this category are married and living apart from their spouses compared with 7 percent in more settled populations.
Over time, as men who have migrated in search of economic opportunity settle down, women join the migration in greater numbers. Wives who had stayed behind join their husbands, new marriages are formed, and eventually children are born. Inevitably, the impact of the migration on the receiving community changes as the years pass. Recent case studies conducted in Atlanta showed that when married men migrated to the United States, their wives tended to join them within three years (Rees, 2001).
Variations at the County Level
Not all new settlement areas in the South are the same. The characteristics described above appear with different levels of intensity in different counties.
Cobb County, Ga., which is just northwest of Atlanta, exemplifies this kind of Hispanic population growth. The foreign born make up 65 percent of the Latino population, and among those migrants, most (72%) report Mexico as their birthplace. There are 152 males for every 100 females among the Latino foreign borm, and these migrants are mostly young adults; their median age is 27. Most (56%) have not completed high school and a similar share (57%) reported limited or no English proficiency.
If Cobb County has the typical profile of a new Latino settlement in the South, then Robeson County, N.C., illustrates one of the more extreme cases. Its Latino population is younger and even more foreign-born than most new settlement counties, and far more male dominated. Located south of Fayetteville and stretching to the South Carolina border, Robeson County has an unusually diverse population that includes a large share of American Indians (38% in 2000) and a diverse economy (tobacco farming and manufacturing). Here, a higher than average share of Latinos, 67 percent, were foreign born in 2000, and among those foreign-born Latinos the median age was only 24. A substantial majority (75%) has not completed high school and 65 percent reported limited or no English proficiency. Robeson also had the highest maleto- female ratio of the new settlement counties with 253 foreign-born Latino males per 100 females.
At the other extreme is Shelby County, Tenn., which encompasses most of the Memphis metropolitan area. Shelby County’s Latino population was relatively less foreign born, older and more evenly balanced between male and female immigrants. Only 54 percent of Latinos in Shelby were foreign born, and the median age was 28. They were better educated; just 50 percent of foreign-born Latinos in Shelby lacked a high school diploma. Only 53 percent reported limited or no English proficiency. Although not the lowest for any county, the ratio of males to females among all Latinos was 133, lower than the average of 142 for all of the 36 counties combined, again reflecting the fact that the population mix in Shelby has a greater share of native-born Latinos than more typical new settlement counties in the South.