For this report, we conducted nationally representative Pew Research Center surveys of 16,254 adults from March 12 to May 26, 2021, in 16 advanced economies. All surveys were conducted over the phone with adults in Canada, Belgium, France, Germany, Greece, Italy, the Netherlands, Spain, Sweden, the United Kingdom, Australia, Japan, New Zealand, Singapore, South Korea and Taiwan. Responses are weighted to be representative of the adult population in each public. Respondents in these publics were asked the following open-ended question: “We’re interested in exploring what it means to live a satisfying life. What aspects of your life do you currently find meaningful, fulfilling or satisfying?” Responses were transcribed by interviewers in the language in which the interviews were conducted.
In the United States, we surveyed 2,596 adults from Feb. 1 to 7, 2021. Everyone who took part in the U.S. survey is a member of the Center’s American Trends Panel (ATP), an online survey panel that is recruited through national, random sampling of residential addresses. This way nearly all adults have a chance of selection. The survey is weighted to be representative of the U.S. adult population by gender, race, ethnicity, partisan affiliation, education and other categories. In the U.S., respondents were asked a slightly longer version of the same question: “We’re interested in exploring what it means to live a satisfying life. Please take a moment to reflect on your life and what makes it feel worthwhile – then answer the question below as thoughtfully as you can. What about your life do you currently find meaningful, fulfilling or satisfying? What keeps you going and why?”
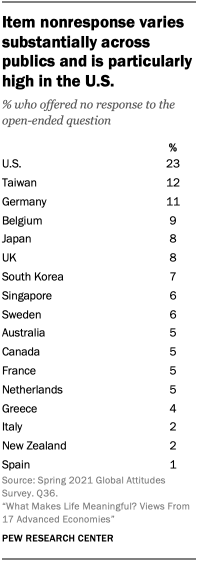
On each of these surveys, the open-ended question was the last substantive question given to respondents. In the U.S., as the survey was self-administered, this late placement may have led to greater nonresponse than on the phone surveys where respondents were still in contact with the interviewer and asked to verbally give their answer, rather than type. In the U.S., item nonresponse was nearly twice as high as the public with the next highest nonresponse rate, Taiwan, and in most places surveyed, fewer than 10% said they did not have a response or refused to answer the question.
Codebook development
To develop a codebook for the main sources of meaning mentioned across the 17 advanced economies, Center researchers iteratively reviewed random samples of native English and non-English responses translated by Google Translate. Researchers mapped out the key concepts that commonly appeared in the responses using a process called “open coding.” After developing an initial set of categories that seemed comprehensive and well-defined, researchers tested the codebook on a random sample of 150 native English responses to evaluate the codebook’s conceptual validity. They then reviewed their disagreements and refined the codebook before testing it again on another sample.
After three iterations of this process, researchers were able to determine that the codebook was clear enough that other coders could independently apply it in a consistent manner. The codebook’s overall Krippendorf’s alpha, measured using Measuring Agreement on Set-Valued Items (MASI) distance as a similarity measure, was 0.72 across the 20 codes in the codebook. Krippendorf’s alpha, measured traditionally using a binary measure, was also above 0.7 for each individual code except for the “Don’t know/refused” category, which appeared only once in the final sample used for codebook development. Using these intercoder reliability scores as a benchmark of acceptable performance, Center researchers then trained a larger group of in-house coders and professional translators to apply the codebook at scale to the full set of English and non-English responses, respectively.
Coding non-English responses
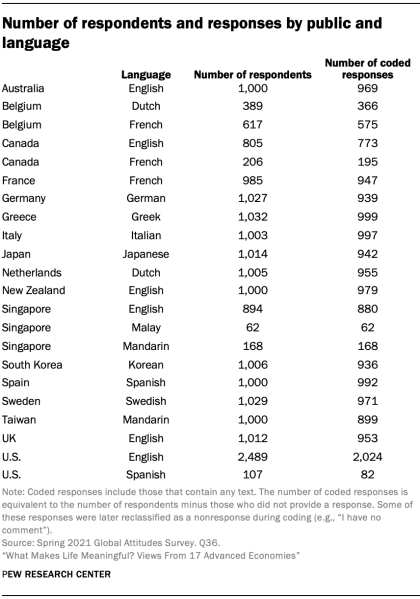
To code the 11,025 non-English responses that were collected in 11 different languages across 14 separate publics, the Center partnered with a professional translation firm, cApStAn. After thoroughly studying the codebook and participating in training sessions, professional translators from cApStAn coded a random sample of 10% of non-English responses (1,103 responses), stratified by language and public. They also translated the responses into English, took care to record any questions and comments they had during the coding process and provided the Center with extensive notes alongside the coded and translated responses. To evaluate intercoder reliability, the translated responses were divided up and coded by the same Center researchers that developed the codebook and established its conceptual validity.
After coding the English translations, Center researchers carefully reviewed the translators’ notes and corresponding disagreements, and further refined the codebook with clarifying guidelines and decision rules. Center researchers also looked for possible systematic misunderstandings of the codebook within each language and public subset in the sample. For each subset (e.g., Mandarin in Singapore), the Center identified specific codes where the Krippendorf’s alpha (binary) was under 0.7 with at least five disagreements, two-thirds of which were either false positives or false negatives. Researchers then reviewed these disagreements and developed further guidelines to help resolve these apparent misunderstandings. For these specific cases – where the professional translators seemed to be interpreting the codebook differently than the Center’s in-house coders – the Center provided them with codebook revisions and asked them to recode all of their responses in their public/language subset for the specific code on which they had performed poorly. The translators were not provided any specifics on how they had disagreed with the Center and were simply given a new version of the codebook and instructed to take a second look at their coding decisions.
The Center calculated intercoder reliability after receiving revised codes and determined that the professional translators had achieved an understanding of the codebook acceptable enough that they could apply it independently. The overall agreement between Center researchers and the professional translators was 0.7 (measured using MASI-distance Krippendorf’s alpha) and code-level agreement (using standard binary Krippendorf’s alphas) was above 0.7 for each of the 20 codes independently.
Before the professional translators independently coded the remaining 90% of non-English responses, the Center provided a final round of extensive feedback, including personalized reports for each translator detailing their disagreements along with notes explaining the Center’s decision-making process. As the professional translators further improved their understanding of the codebook after reviewing this feedback, it is likely that the intercoder reliability scores reported above represent a lower-bound estimate of their actual coding performance on the remaining non-English responses.
Coding English responses

To code the responses that were collected natively in English from six different publics and not already coded in the prior samples described above, Center researchers trained a larger group of nine coders to apply the codebook independently. Each coder was given a random sample of 150 English responses and evaluated for intercoder reliability. To do so, the original researchers involved in the codebook’s development independently coded the sample and resolved their disagreements to arrive at a consensus. Coders were then evaluated against this baseline and given feedback similar to that provided to the professional translators, including notes on the cases where they disagreed with the baseline. Those whose overall MASI-distance Krippendorf’s alpha was at or above 0.7 began independently coding the full queue of native English responses, drawing responses randomly and proceeding at their own pace. Those below 0.7 were given additional random responses until they improved.

Each in-house coder coded between 265 and 2,280 of the 6,770 native English responses. Weighted proportionally by their contribution to the total, the in-house coders achieved an overall effective intercoder reliability MASI-distance Krippendorf’s alpha of 0.77. Their collective reliability (measured by standard binary Krippendorf’s alphas) was also at or above 0.7 for each code independently, with the exception of the “General positive” code, where it was 0.66.
Characteristics of responses and codes

Beyond the variation in item nonresponse discussed above, publics also vary in how much detail the average respondent provided. For example, English responses in the U.S. average 31 words, nearly twice as long as the 18 words provided by the average respondent in Australia and New Zealand. While this particular gap is likely attributable to mode differences – responses in the U.S. were collected over the web instead of phone – response length also varies between the publics that were surveyed by phone. In the UK, respondents provided an average of eight words – less than half that of Australia and New Zealand.
Whether due to mode, cultural, demographic or other factors, variation in response length ultimately manifests as variation in the number of topics mentioned in a given response. For example, across the 17 publics surveyed, a median of 34% responded to the question about what gives them meaning in life by mentioning only one of the topics researchers coded (e.g., family). But the share is particularly high in South Korea and Japan.
These differences help explain why the share giving a particular answer in certain publics may appear much lower than others, even if it is the top mentioned source of meaning for that given public. To give a specific example, 19% in South Korea mention material well-being while 42% say the same in Spain, but the topic is ranked first in South Korea and second in Spain. Given this, researchers have chosen to highlight not only the share of the public that mentions a given topic but also the topic’s relative ranking among all topics coded.
Controlling for topic salience in demographic differences
Across all publics, certain topics are more likely to be mentioned than others. For example, family is consistently mentioned more frequently than pets. This is partly due to the fact that family brings more meaning and fulfillmentthan pets do for some people. However, it is also partly attributable to the fact that pets are simply a less salient source of meaning than family – that is, all else equal, people are more likely to think of their family off the top of their head than they are their pets. In other words, whether or not someone mentions finding meaning in pets is not just a function of whether they have pets or care about them, but also a function of how much thought they gave to the question and how much detail they provided in their answer. Across all publics, the average respondent tended to mention the first one or two sources of meaning that they could think of, which often included family. Pets, on the other hand, tended to be mentioned by those who reference multiple sources of meaning; generally, mentions of pets occurred alongside mentions of one to four other topics.
As described above, response length varies between the publics surveyed – but it also varies substantially within each public as well. In any given public, certain demographic groups – often more affluent and more educated people – are more likely to answer the question and provide more detailed responses. Because of this, these groups may appear to be uniquely more likely to mention rarer topics like pets, when these demographic differences are simply being driven by a topic’s overall salience and likelihood of appearing in longer responses.
Accordingly, all significant demographic differences reported in this analysis are verified using regressions that control for the total number of topics mentioned in a given response, normalized using a base-10 logarithmic scale. This measure roughly approximates the amount of detail provided in each response, and controls for each topic’s overall tendency to be brought up in more detailed responses. The reported differences therefore represent a particular demographic group’s likelihood of mentioning a given topic beyond the group’s tendency to simply provided longer (or shorter) responses.
Selection of quotes
Open-ended responses included in the report and in the interactive [add hyperlink] have been lightly edited for clarity (and, in some cases, translated into English by a professional firm). They have been purposefully – not randomly – selected to illustrate key points, and selected responses may not be representative of all responses for a given public.
More details about our international survey methodology and country-specific sample designs are available here. For respondents in the U.S., read more about the ATP’s methodology here.