To provide comparable data across countries, population estimates for countries of residence and countries and territories of birth for sub-Saharan migrants rely on global migrant stock by their origins and destinations as estimated by the United Nations (UN) for 2015. Estimates for the number of sub-Saharan immigrants living in each destination country differ slightly from totals provided by destination governments featured in this report because of UN estimation procedures.
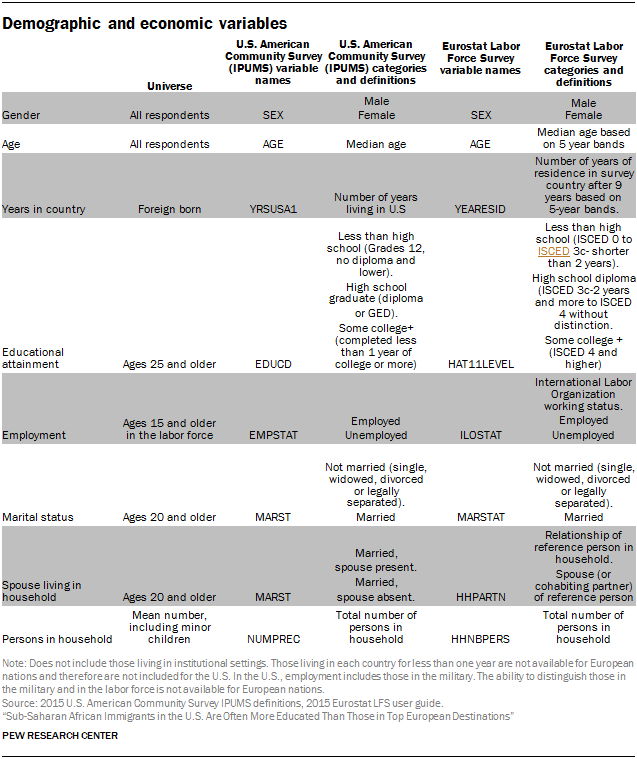
Demographic and economic findings, such as education, employment, time in country, sex, age, marital status and household composition, were based on two large-scale household surveys – the U.S. Census Bureau’s 2015 American Community Survey (ACS) and Eurostat’s 2015 Labor Force Survey, a data compilation of common variables from labor force surveys across European Union countries.
Survey sampling designs, populations of analysis and data access
Survey countries’ data collection methods vary. For the surveys’ complete sampling and data collection methodologies, see the ACS’s methodology website and Eurostat’s Labor Force Survey annual methodological report. All surveys are considered nationally representative.
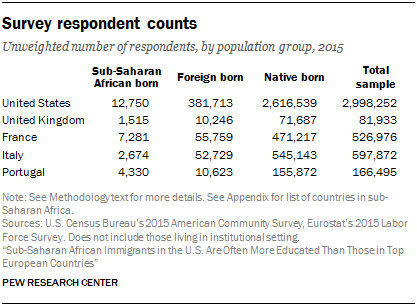
The year 2015 was the common year for migrant population estimates from the UN as well as surveys in the U.S. and European countries. The United States and top European countries of residence for sub-Saharan immigrants (United Kingdom, France, Italy and Portugal) as estimated by the UN, were selected for analysis.
Many sub-Saharan immigrants in the U.S. and selected European countries were born in African countries where the European-surveyed country’s language is also widely spoken. Consequently, it is expected that many sub-Saharan African immigrants surveyed could respond to the surveys. Italy is an exception; in most of the origin countries for sub-Saharan immigrants, Italian is not an official language.
The American Community Survey data were accessed via Integrated Public Use Microdata Series or IPUMS-USA (University of Minnesota). Eurostat’s Labor Force Surveys was provided by Eurostat to use microdata for scientific use. Data in both surveys were anonymized to protect the identity of respondents.
Variables used in each survey
Comparable variables between the U.S. and European countries are reported. The following table lists the variables, universes, variable names and categories.15