

After a sharp drop in naturalizations in the early stages of the coronavirus pandemic, immigrants in the United States are becoming citizens in numbers not seen for more than a decade.
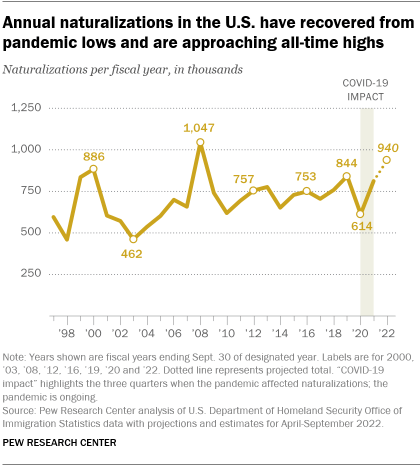
More than 900,000 immigrants became U.S. citizens during the 2022 fiscal year, according to a Pew Research Center estimate based on government data released for the first three quarters of the year. That annual total would be the third-highest on record and the most in any fiscal year since 2008, when more than a million people were naturalized. Federal fiscal years run from Oct. 1 to Sept. 30.
The rebound in naturalizations aligns with upticks in other measures of legal immigration since the spring of 2020, when pandemic-related restrictions, border closures and office shutdowns were widespread. Government data shows a rise since then in the number of immigrants receiving green cards as new lawful permanent residents, as well as a partial rebound in arrivals by foreign students, tourists and other lawful temporary migrants.
Here are five key facts about naturalization trends and U.S. naturalized citizens, based mainly on a Pew Research Center analysis of data from the Department of Homeland Security and the Census Bureau. Immigrants generally are eligible to become U.S. citizens if they are at least 18 years old and a lawful permanent resident who has lived continuously in the U.S. for at least five years, or three years if married to a U.S. citizen. They must meet certain conditions that include a background check and, in most cases, must pass English language and civics tests. Citizenship confers privileges and obligations that include the right to vote, serve on a jury, sponsor other family members and apply for government benefits and jobs.
This Pew Research Center analysis examines trends in naturalizations – that is, the number of lawful immigrants who become U.S. citizens – during the COVID-19 pandemic. To conduct this analysis, the Center used data from two branches of the Department of Homeland Security (DHS): U.S. Citizenship and Immigration Services (USCIS), which is responsible for processing naturalization applications and administering the citizenship oaths; and the Office of Immigration Statistics (OIS), which, among its other duties, publishes immigration data from various DHS operational components. We also used our own estimates of the number of naturalized citizens and lawful immigrants living in the United States, based on an analysis of surveys from the U.S. Census Bureau.
There are three principal sources of DHS data:
- “Yearbook of Immigration Statistics,” various years – This annual report has a section devoted to data on naturalizations. Table 20 has the annual number of naturalizations from 1907 through the most recent fiscal year. Table 21 has data on naturalizations by region and country of birth for the most recent years; we used data from 2021 and various earlier years to compile data on country and region of birth for fiscal years 1997 through 2021.
- Legal Immigration and Adjustment of Status Reports from OIS – These reports have quarterly data on lawful admissions, refugee arrivals, naturalizations and arrivals of temporary migrants. Table 3 has quarterly data on naturalizations by country of birth. These reports were first done for fiscal 2016 and have been released through the second quarter of fiscal 2022 (January-March 2022). We used these reports to compile data on naturalizations by country and region of birth for the most recent 12 months (April 2021-March 2022).
- N-400 reports from USCIS – These reports have data on naturalizations: applications received, approved, denied and pending. They are available from the beginning of fiscal 2012 (October-December 2011) on a quarterly basis through the third quarter of fiscal 2022 (April-June 2022). The N-400 reports focus on operational concerns and have limited demographic information and no data on country or region of birth. These reports were the source for applications and backlogs. For fiscal years 2012-2015 and the third quarter of fiscal 2022, we used N-400 reports for information on total naturalizations after aligning them with totals published in the “Yearbook of Immigration Statistics.”
To estimate the total number of naturalizations for fiscal 2022, a figure not yet published, we projected naturalizations for the fourth quarter of the year (July-September 2022) based on seasonal patterns for fiscal 2012-2019 and the total number of naturalizations for the first three quarters of the year from the sources noted above.
Estimates of the number of naturalized citizens and lawful permanent residents living in the U.S. for 1995-2019 are from Pew Research Center estimates of the foreign-born population by legal status, including unauthorized immigrants. These estimates are based on the data from the U.S. Census Bureau: American Community Survey for 2005-2019 and the annual March supplements to the Current Population Survey for 1995-2004. Here is an overview of the methodology; for more details, read the methodology section of this previously published report.
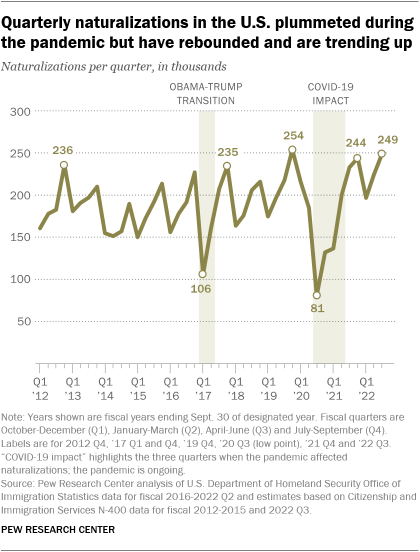
Quarterly naturalizations are back to where they were before the coronavirus outbreak began in early 2020. The quarterly number of naturalizations plummeted to 81,000 in the April-June 2020 period – during the first months of the U.S. outbreak – compared with an average of about 190,000 per quarter in the previous eight years. After two more below-average quarters, the number of naturalizations reached 200,000 in the January-March 2021 quarter – higher than the total for the same quarter in any of the nine previous years. Naturalization levels for 2021 and 2022 fiscal years have continued to outpace most pre-pandemic years.
The Center’s projection for the number of annual naturalizations for fiscal 2022 – about 940,000 – is higher than for any year since fiscal 2008, when an all-time high of 1,047,000 immigrants became citizens. Fiscal 2008 was one of three previous peaks in naturalizations during the past half-century. The others, in fiscal 1996 (1,041,000) and 2000 (886,000), far exceeded annual naturalizations in any year since 1907, the earliest year with available statistics.
There have been an average of about 200,000 applications for U.S. citizenship per quarter over the past decade. Since 2012, the quarterly number of applications for naturalization has generally ranged from about 160,000 to 250,000. Before the pandemic, there were two notable upticks in quarterly applications: one shortly before the 2016 presidential election (April-June 2016) and one shortly after it (January-March 2017).
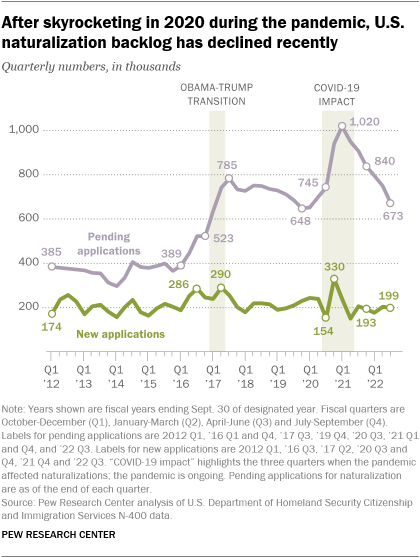
The number of applications dropped to 154,000 in the April-June 2020 quarter, just after the pandemic began, but rebounded to 330,000 the following quarter (July-September). Going back to 1980, applications peaked in fiscal 1997, reflecting a surge in naturalizations by formerly unauthorized immigrants who gained legal status under legislation passed in 1986 and thus became eligible to naturalize after the usual five-year waiting period. There was another peak in applications in fiscal 2007, ahead of an announced increase in application fees.
More immigrants are seeking U.S. citizenship than are currently being naturalized. As of the end of June 2022, there was a backlog of about 673,000 pending applications for naturalization. The backlog is down from more than a million pending applications in December 2020, but still much higher than in the period between 2012 and 2016.
Several factors can affect the number of pending applications for naturalization. In the early stages of the pandemic, for example, immigration field offices closed, and the number of pending applications rose sharply in the ensuing months.
By August 2020, U.S. Citizenship and Immigration Services had administered the oath of allegiance to nearly every naturalization applicant whose ceremony was postponed when immigration offices were closed, according to an evaluation of government performance during the pandemic. The median time to process a naturalization application, 9.1 months in fiscal 2020, rose to 10.5 months in fiscal 2022.
Naturalizations for immigrants from most countries plunged during COVID-19 but have since rebounded and are 20% above their pre-pandemic average. One prominent exception is naturalizations of immigrants from China, one of the top 10 countries for naturalizations overall. Naturalizations of Chinese nationals are down about 20% from their pre-pandemic average.
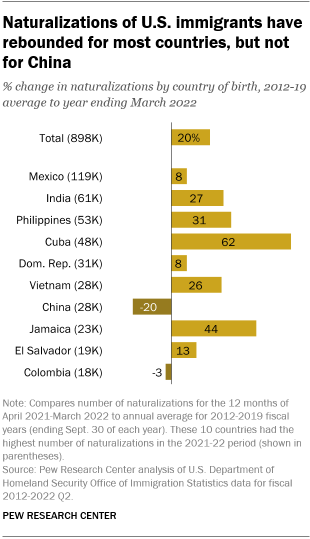
Mexico, the country with the most annual naturalizations over the past quarter century, is up by only 8% compared with its pre-pandemic average. Most of the other major countries are up at least as much. On a regional basis, sub-Saharan Africa, Asia, Latin America and Middle East-North Africa are up by 15% to 26% compared with their pre-pandemic averages. (Due to data limitations, this analysis compares the 12-month period between April 2021 and March 2022 to the annual average from 2012 to 2019. Read “How we did this” for more information.)
The naturalized citizen population in the U.S. continues to increase rapidly. The total number of naturalized citizens in the U.S. almost tripled between 1995 and 2019, from 7.6 million to 22.1 million, according to the most recent Pew Research Center estimates. In contrast, the number of lawful permanent residents – that is, immigrants who may be eligible to be naturalized but have not done so – changed relatively little during that period, remaining between 11.2 million and 12.4 million.
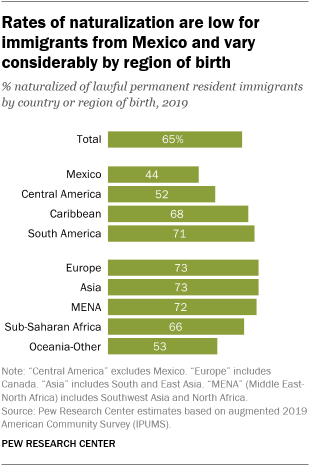
The share of lawful immigrants who were naturalized grew steadily from 38% in 1995 to 65% in 2019. Lawful immigrants from Europe and Asia (both 73%) are the most likely to have been naturalized, followed by those from Middle East-North Africa (72%), sub-Saharan Africa (66%) and Latin America (56%).
The countries with the smallest proportion of lawful immigrants who are naturalized U.S. citizens (among those with at least 100,000 naturalized citizens overall) are El Salvador, Guatemala, Honduras, Japan and Mexico. Fewer than half of lawful immigrants from these countries are naturalized citizens.
In contrast, the countries with the highest proportion of lawful immigrants who have been naturalized include Cambodia, Guyana, Iran, Laos, Poland, Portugal, Romania and Vietnam. At least 80% of immigrants from these countries have gained U.S. citizenship.
Immigrants are more likely to be naturalized if they speak English very well, have strong ties to the U.S. and have lived in the U.S. for a long time.

