
The U.S. incarceration rate fell in 2019 to its lowest level since 1995, according to recently published data from the Bureau of Justice Statistics (BJS), the statistical arm of the Department of Justice. Despite this decline, the United States incarcerates a larger share of its population than any other country for which data is available.
Pew Research Center conducted this analysis to examine how incarceration patterns in the United States are changing. Most of the U.S. data in this analysis comes from the Bureau of Justice Statistics, the statistical agency of the U.S. Department of Justice. The U.S. incarceration rate is calculated as the number of people in federal and state prison, as well as in locally run jails, per 100,000 adult residents ages 18 and older.
Additional data for the U.S., as well as for more than 200 other countries and territories, comes from the World Prison Brief, a database maintained by the Institute for Crime & Justice Policy Research at Birkbeck, University of London. To allow for more direct comparisons between countries, international incarceration rates are calculated as the number of people in prison or jail per 100,000 residents of all ages. The most recent data available for each country or territory varies by year. World Prison Brief data was accessed on Aug. 10, 2021.
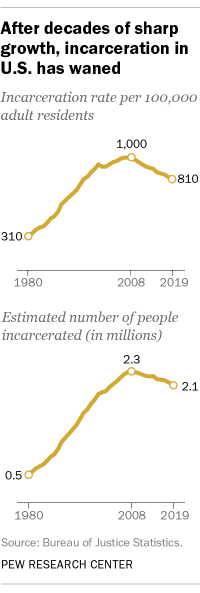
At the end of 2019, there were just under 2.1 million people behind bars in the U.S., including 1.43 million under the jurisdiction of federal and state prisons and roughly 735,000 in the custody of locally run jails. That amounts to a nationwide incarceration rate of 810 prison or jail inmates for every 100,000 adult residents ages 18 and older.
The nation’s incarceration rate peaked at 1,000 inmates per 100,000 adults during the three-year period between 2006 and 2008. It has declined steadily since then and, at the end of 2019, was at the same level as in 1995 (810 inmates per 100,000 adults).
The number of prison and jail inmates in the U.S. has also decreased in recent years, though not as sharply as the incarceration rate, which takes population change into account. The estimated 2,086,600 inmates who were in prison or jail at the end of 2019 were the fewest since 2003, when there were 2,086,500. The prison and jail population peaked at 2,310,300 in 2008.
It is not yet clear how the coronavirus pandemic may have affected the U.S. incarceration rate; statistics for 2020 are not expected to be released until later this year. But media reports suggest that the decline in incarceration may have continued and perhaps even accelerated in 2020.
A variety of factors help explain why U.S. incarceration trends have been on a downward trajectory. Violent and property crime rates have declined sharply in recent decades despite a more recent increase in certain violent crimes, especially murder. As crime has declined, so have arrests: The nationwide arrest rate has fallen steadily over the long term.
Changes in criminal laws, as well as prosecution and judicial sentencing patterns, also likely play a role in the declining incarceration rate and number of people behind bars. In late 2018, for example, then-President Donald Trump signed a law aimed at reducing the federal prison population. In its first year, the law led to shorter sentences for thousands of federal offenders and earlier release dates for many others, according to a 2020 report from the U.S. Sentencing Commission.
See also: Under Trump, the federal prison population continued its recent decline
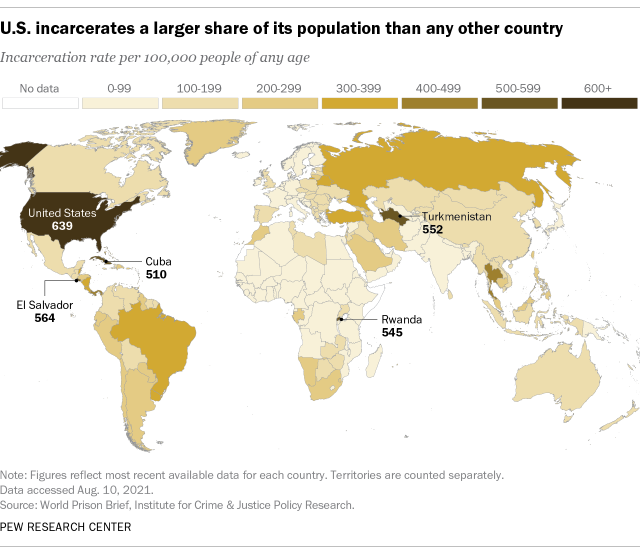
Despite these downward trends, the U.S. still has the highest incarceration rate in the world, according to the World Prison Brief, a database maintained by the Institute for Crime & Justice Policy Research at Birkbeck, University of London. The database compares incarceration rates across more than 200 countries and territories using publicly available data for each jurisdiction.
It’s important to note that the World Prison Brief’s U.S. data differs in some ways from the BJS data cited above. While the BJS statistics above refer to the number of inmates per 100,000 adult residents ages 18 and older, for example, the World Prison Brief measures each country’s incarceration rate as the number of inmates per 100,000 residents of any age.
The World Prison Brief’s data estimates the U.S. incarceration rate at 639 inmates per 100,000 people as of 2018, or 13% higher than the rate of the next-closest country, El Salvador (564 inmates per 100,000 people). The U.S. rate is also far higher than the rates of other heavily populated nations, including Brazil (357 per 100,000) and Turkey (335 inmates per 100,000 people). Incarceration rates in Western Europe are less than a quarter of the U.S. rate: In England and Wales, there are 131 inmates for every 100,000 people, while France and Germany incarcerate 93 and 69 people, respectively, for every 100,000 residents.
In addition to its high rate of incarceration, the U.S. also has the largest overall number of people behind bars. With more than 2 million jail and prison inmates, the U.S.’s total incarcerated population is significantly greater than that of China (approximately 1.7 million) and Brazil (about 760,000). But data limitations in China and other countries make direct comparisons with the U.S. difficult. The World Prison Brief notes, for instance, that China’s total excludes people held in pre-trial detention or “administrative detention” – a group that may number more than 650,000. China’s total also excludes the estimated 1 million Uyghur Muslims who are reportedly being detained in camps in the Xinjiang autonomous region. If these two groups were added to the total, China would far surpass the U.S. in terms of its total incarcerated population.
Note: This is an update of a post originally published on May 2, 2018.
