
A century after the 19th Amendment gave women the right to vote, about half of U.S. adults (49%) – including 52% of men and 46% of women – say granting women the right to vote has been the most important milestone in advancing the position of women in the country, relative to other notable events and achievements, according to a recent Pew Research Center survey.
And women have largely exercised this right: In every U.S. presidential election dating back to 1984, women reported having turned out to vote at slightly higher rates than men, according to a new analysis of Census Bureau data by the Center. At the same time, the gender gap in party affiliation continues to widen.
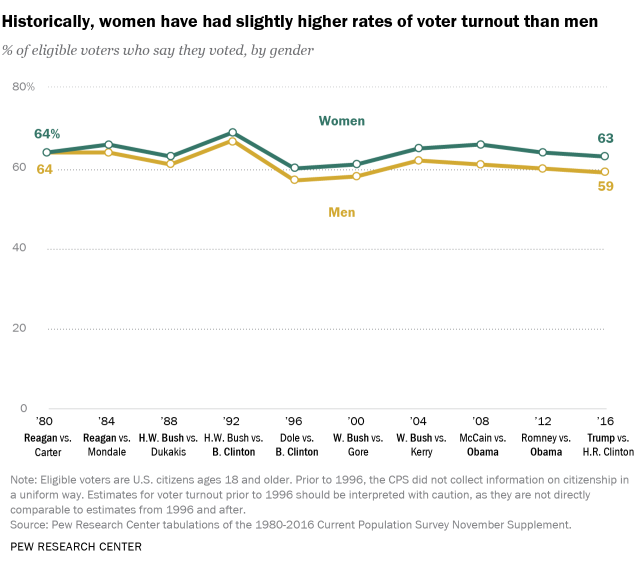
In 2016, 63% of women who were eligible to vote said they cast ballots in the presidential election, compared with 59% of men. That 4 percentage point gender gap is similar to the 4-point gaps in 2012 and 2008 as well as the 3-point gaps in 2004, 2000 and 1996. In 1980, when voter turnout data first became available, there was no gender gap in turnout: 64% of both men and women reported turning out to vote in that year’s election. These patterns are also similar for midterm elections.
To mark the 100th anniversary of the 19th Amendment that gave women the right to vote, we sought to explore the extent to which women have exercised their franchise compared with men in recent decades and how the gender gap in voter turnout differs by race, ethnicity and education. This post also looks at gender patterns in party identification and the intersection of gender with race, ethnicity and education.
The government data is based on the U.S. Census Bureau’s Current Population Surveys (CPS) from 1980 to 2016. The survey data draws on annual totals of data from Pew Research Center telephone surveys among U.S. registered voters from 1994 to 2018 and 2019 (due to smaller sample sizes in 2018 and 2019, the data from those years has been combined). The methodology for those surveys can be found here.
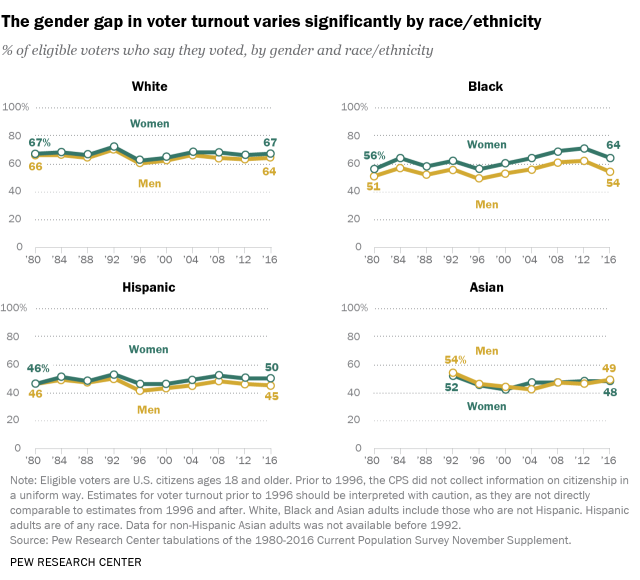
Historically, voter turnout has varied significantly by race and ethnicity, with White and Black voters more likely to report they voted than Hispanic and Asian American voters. Still, within each of these groups, gender gaps persist. The gender gap is widest among Black voters, among whom women have reported voting at higher rates than men consistently for the past 30 years.
In 2016, 64% of eligible Black women said they voted, compared with 54% of eligible Black men. The gender gap among White voters was far smaller (3 percentage points). Still, White men and White women were more likely to say they voted than their Black counterparts (67% of White women and 64% of White men in 2016).
Hispanic women outvoted Hispanic men by about 5 points in 2016 (50% vs. 45%). However, the gender gap among Hispanic voters has not been consistent. At times in the past several decades, Hispanic men and Hispanic women have said they voted at roughly similar shares. Among Asian Americans, there has been no consistent gender gap as long as the trend has been measured. (Due to the relatively small size of the Asian American sample, voter turnout data on Asian Americans only goes back to 1992.)
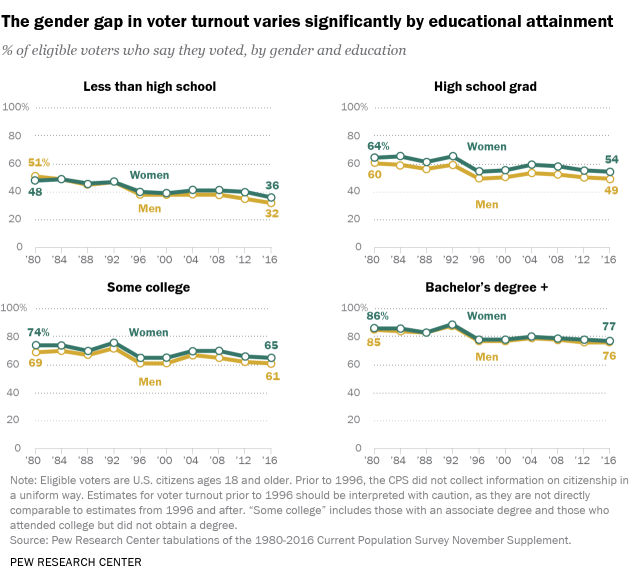
Voter turnout also varies by gender across educational attainment. For the most part, across levels of education, women are more likely to say they vote than men, though the gender gap in voter turnout is narrower among those with at least a four-year college degree than among those with less education. Overall, voters with more education have consistently been more likely to report turning out to vote than those with less education.
Among White voters with a bachelor’s degree or higher, women (80%) were only slightly more likely than men (78%) to say they voted in 2016, a trend that has been fairly consistent over time. Similarly, college-educated Black women were only slightly more likely than college-educated Black men to report turning out to vote in 2016 (74% vs. 71%).
Among less educated White voters, the gender gap expands significantly: 60% of White women without a four-year degree said they voted in 2016, compared with 56% of White men without a degree. The gender gap is particularly wide among less educated Black voters. Roughly six-in-ten Black women without a college degree (61%) said they voted in 2016, compared with 50% of Black men without a degree – an 11-point gap. The gender gap among less educated Black voters has been growing steadily over time.
Hispanic voters who do not have a college degree are among the least likely to report turning out to vote. Still, men and women differ in this group. Hispanic women without a college degree were more likely than men with similar levels of education to report voting in 2016 (46% vs. 40%). This gap has been growing over time. Among more educated Hispanic voters, there has been far less of a gender turnout differential in recent years. In 2016, college-educated Hispanic men were more likely than Hispanic women with a degree to report turning out to vote (70% vs. 67%).
The Census Bureau’s biennial Current Population Survey (CPS) November Voting and Registration Supplement is the best postelection survey of voting behavior available because of its large sample size and its high response rates. It is also one of the few data sources that provides a comprehensive demographic and statistical portrait of U.S. voters.
(Official voting records provide actual individual-level turnout data, but they do not contain voters’ full demographic details. Pew Research Center and other organizations match voter file data to surveys, providing another high-quality source of this information.)
But estimates based on the CPS November Supplement often differ from official voting statistics based on administrative voting records. This difference has been attributed to the way the CPS estimates voter turnout – through self-reports (which may overstate participation) and a method that treats nonresponses from survey respondents as an indication that the survey respondent did not vote (which may or may not be true).
To address overreporting and nonresponse in the CPS, Aram Hur and Christopher Achen in a 2013 paper proposed a weighting method that differs from the one used by the Census Bureau in that it reflects actual state vote counts. As a result, voter turnout rates reported by the Census Bureau (and shown in this analysis) are often higher than estimates based on this alternative weighting approach.
Party identification differs widely by gender, especially among college graduates
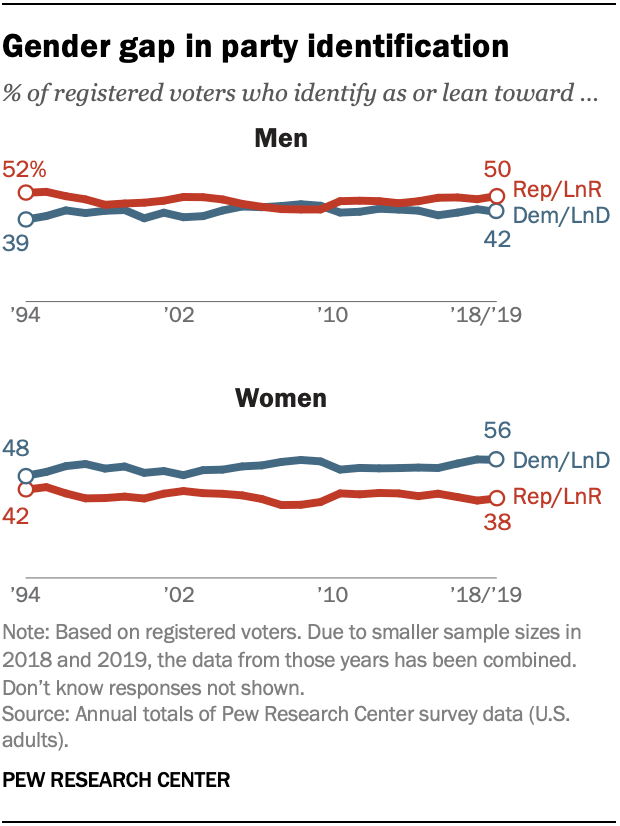
In addition to the gender gap in voter turnout, partisan preferences differ widely by gender. Pew Research Center survey data going back more than two decades shows a growing gender gap in partisan affiliation. In 2018 and 2019, the Democratic Party held a wide advantage with women: 56% of female registered voters identified as Democrats or leaned toward the Democratic Party, while 38% identified as Republicans or leaned toward the GOP. This stands in contrast to men, among whom 50% were Republicans or GOP leaners and 42% identified as or leaned Democratic. This gender gap has been slowly growing wider since 2014.
Party affiliation, like voter turnout, differs significantly by race and ethnicity. Within each racial and ethnic group, however, there is a gender gap in partisan identification; in each case, women are more likely than men to identify as Democrats.
White women have been more likely than White men to identify as Democrats over the past several decades, though the gender gap has grown over time. In 2018 and 2019, 48% of White women identified as Democrats, compared with 35% of White men. By comparison, White men were more likely to identify as Republicans than White women in 2018 and 2019 (58% vs. 47%).
Among Hispanic voters, majorities of women and men identify as Democrats, but this is especially the case among Hispanic women (67% identified as Democrats vs. 58% of Hispanic men in 2018 and 2019). Similarly, Black women (87%) were more likely than Black men (77%) to identify as Democrats, even though large majorities of both did so. In 2018 and 2019, the gap between Black women and Black men identifying as Democrats was the widest it has been since measurement began.
The gender gap in partisan identification also varies by educational attainment. Men and women with a bachelor’s degree or more education are significantly more Democratic in their orientation than 25 years ago. Still, college-educated women (65%) were much more likely than college-educated men (48%) to identify as Democrats in 2018 and 2019.
Among less educated voters, the Democratic Party holds an edge with women (51% of women without a college degree identified as Democrats vs. 42% who identified as Republicans), while men without a degree were more likely to identify as Republicans (52% vs. 40% who identified as Democrats). This represents a marked gain for the GOP among men without a college degree. As recently as 10 years ago, this group was roughly evenly split between Democrats and Republicans. Republican gains among men without a college degree have been driven by a growing edge among white men in this group.
