
Every year since 2004, Pew Research Center has issued an assessment of the state of the news media, tracking key audience and economic indicators for a variety of sectors within the U.S. journalism industry. Here are some key findings about the state of the industry in 2018:
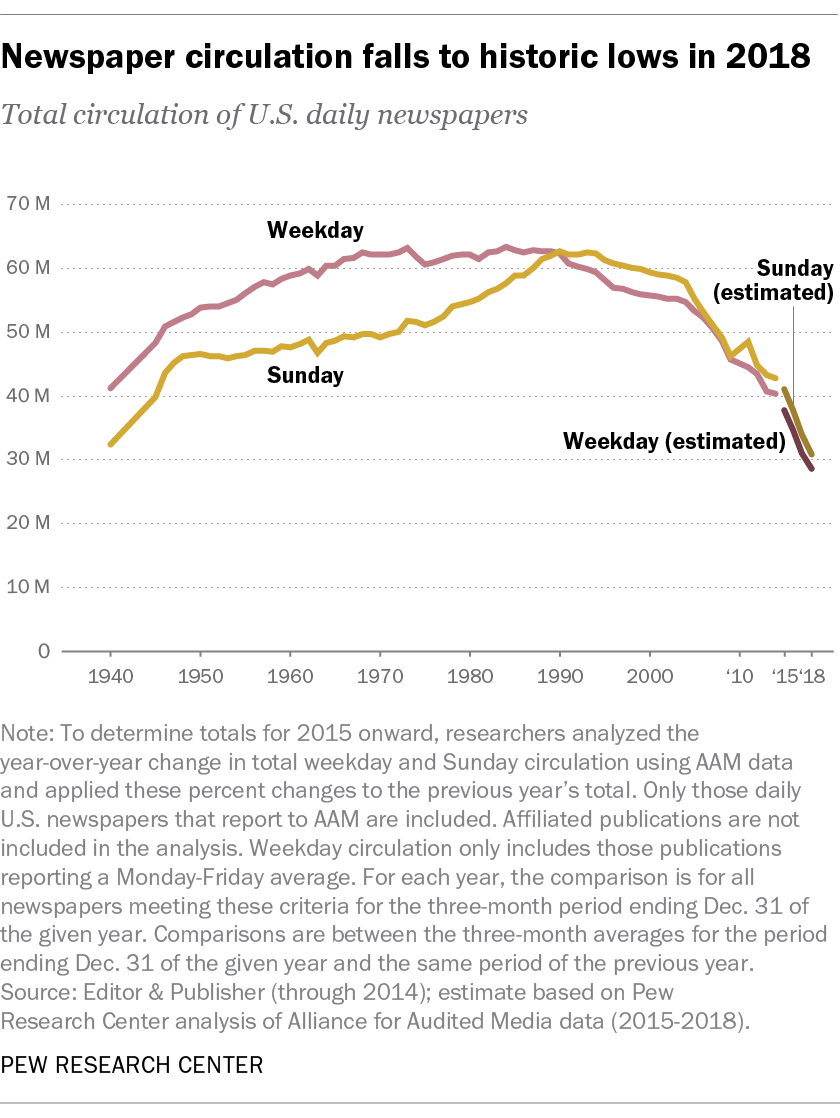
U.S. newspaper circulation reached its lowest level since 1940, the first year with available data. Total daily newspaper circulation (print and digital combined) was an estimated 28.6 million for weekday and 30.8 million for Sunday in 2018. Those numbers were down 8% and 9%, respectively, from the previous year, according to the Center’s analysis of Alliance for Audited Media data. Both figures are now below their lowest recorded levels, though weekday circulation first passed this threshold in 2013.
Digital circulation for daily newspapers is harder to track. It did rise in 2018, though not enough to fully reverse the overall decline in circulation.
Revenue from circulation was steady in 2018, but ad revenue for newspapers fell 13%, according to an analysis of Securities and Exchange Commission filings. Though some national publications have seen growth in revenue and in digital subscriptions over the past few years, the newspaper sector overall continues to face challenges.
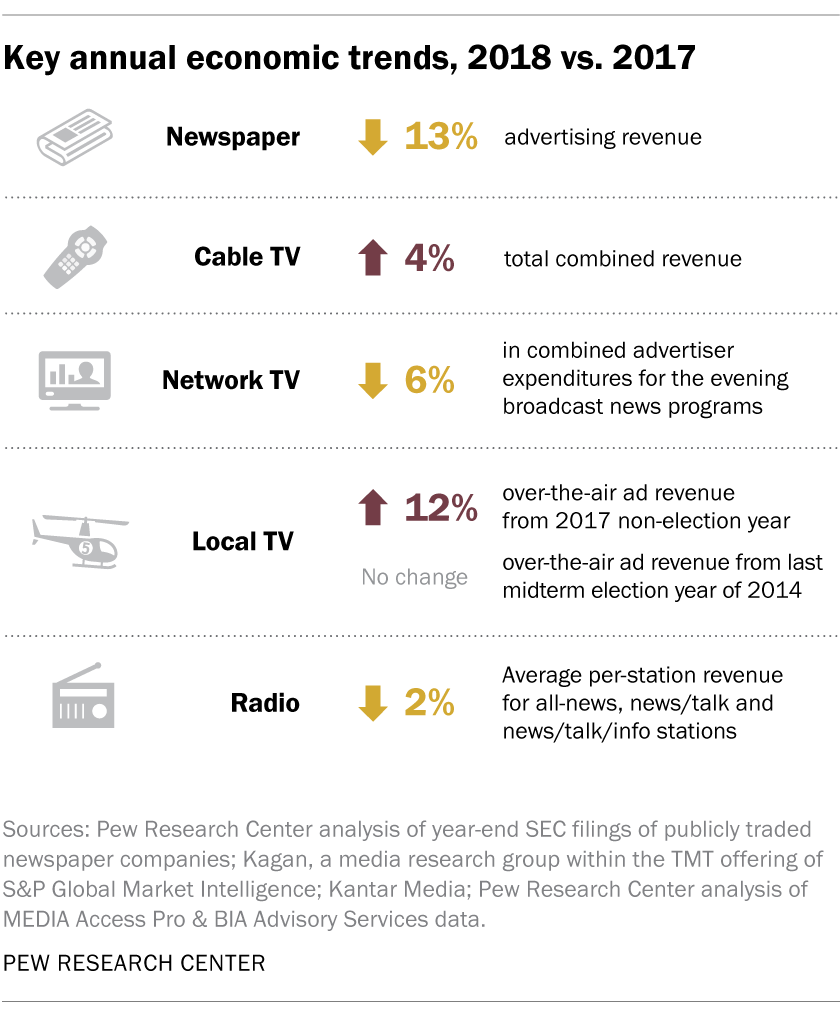
Cable news was a bright spot in another down year for the U.S. news media industry’s economic fortunes. Revenue rose 4% over the past year for Fox News, CNN and MSNBC combined, according to estimates from Kagan, a media research group. That made cable news one of the only sectors with a revenue increase in 2018.
Cable news revenue has grown by roughly a third (36%) since 2015, with ad revenue up 58% over the same period. And unlike some other sectors that typically see revenue declines in non-election years, cable news has been on a steady rise since the 2016 election. Some of this revenue has flowed back into newsroom spending, which has risen 22% since 2015. However, employment in cable TV newsrooms has not risen, according to Bureau of Labor Statistics data, and neither have wages.

Sign up for our weekly newsletter
Our latest data, delivered Saturdays
Digital ad revenue has grown exponentially, but a majority goes to Facebook and Google rather than to publishers. Revenue from ads placed on digital platforms – counting all platforms, not just news sites – rose by 23% in 2018, and now makes up nearly half (49%) of all ad revenue in the U.S., according to eMarketer estimates. And when it comes to display ad revenue – a form of digital advertising that include banners, videos and other advertisements that news organizations and other websites typically run alongside their content – half of all digital revenue went to just two tech companies: Facebook (40%) and Google (12%). Overall digital ad revenue has tripled since 2011, the earliest year tracked, while digital display revenue has grown by almost five times over the same period.
This growth in digital ad revenue has not been enough to make up for the decline in traditional ad revenue for some sectors. About a third of newspaper ad revenue (35%) now comes from digital, according to an analysis of SEC filings, but total ad revenue continues to fall. And while the digital-native news sector is on the rise – its newsroom workforce has nearly doubled over the past 10 years, according to BLS data – this growth hasn’t replaced the loss of employment at newspapers.
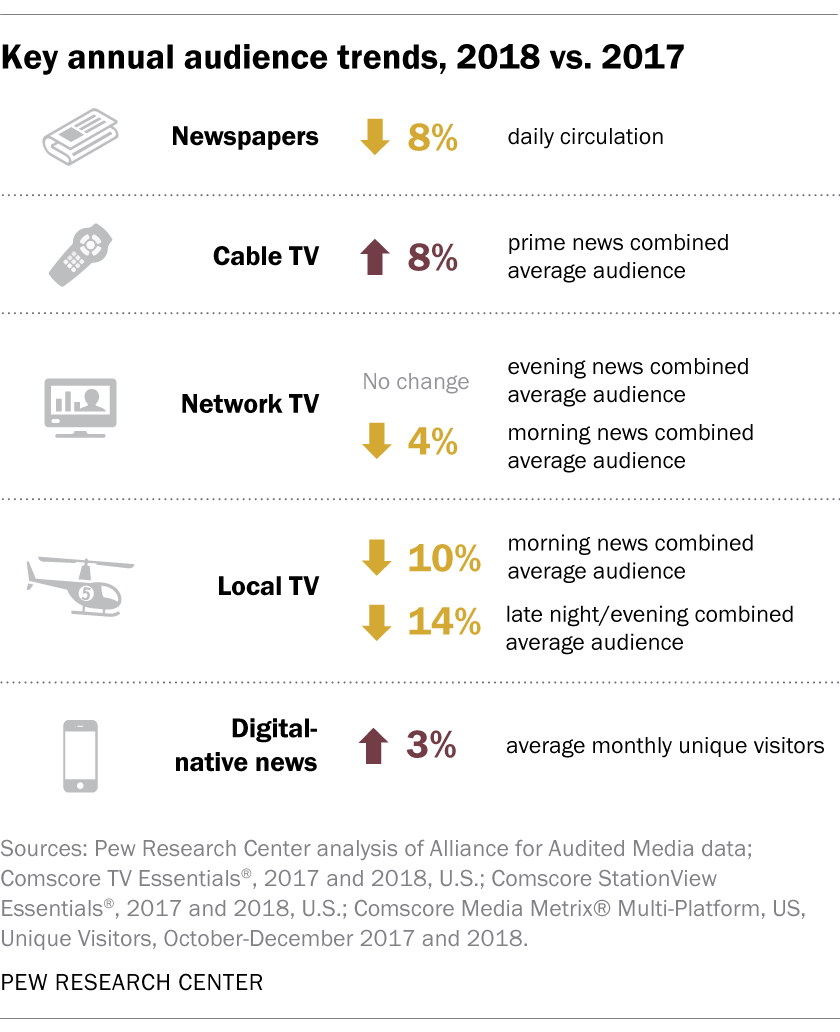
The audience for local TV news has steadily declined. The average audience fell in key time slots in 2018, down 10% for morning news and 14% for late night and evening news, according to Comscore StationView Essentials® data. (This data is based on live viewing on TV sets and does not account for these stations’ websites or social media presences – though some research indicates that most local TV news consumers prefer the TV set to online forms.) This has been a longstanding trend, with declines in 2017 and, using a different data source, from 2007 to 2016.
Over-the-air ad revenue for local TV did rise 12% in 2018, to $19.3 billion, according to a Pew Research Center analysis of MEDIA Access Pro & BIA Advisory Services data, but this is typical for a midterm election year and roughly equal to the amount in 2014.
Local TV’s audience decline was the steepest drop of any sector. Only cable news saw its audience rise in 2018.
Traffic to news websites seems to have leveled off. Unique visitors to the websites of both newspapers and digital-native news sites showed no growth between the fourth quarters of 2017 and 2018, the second year in which there was no notable growth, according to Comscore, a cross-platform audience measurement company. From 2014 to 2016, traffic rose steadily for both these sectors in the fourth quarter.
Time spent on these websites has declined as well: The average number of minutes per visit for digital-native news sites is down 16% since 2016, falling from nearly two and a half minutes to about two per visit. The decreases in website audience and time spent per visit come as Americans increasingly say they prefer social media as a pathway to news.
To learn more: Explore all eight fact sheets on the state of the news media and the methodologies used to compile them.
