Immigrants with past criminal convictions accounted for 74% of all arrests made by U.S. Immigration and Customs Enforcement (ICE) agents in fiscal 2017, according to data from the agency. The remainder were classified as “non-criminal” arrestees, including 16% with pending criminal charges and 11% with no known criminal convictions or charges.
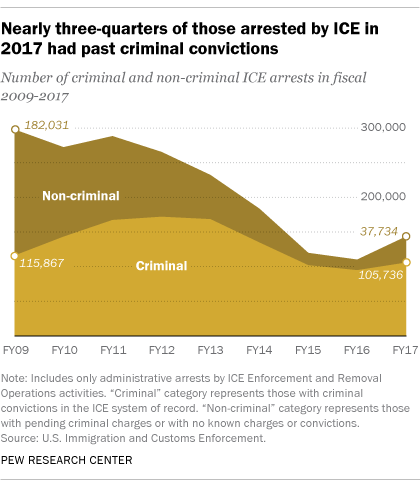
The profile of arrestees by ICE’s Enforcement and Removal Operations has changed considerably in the past eight years: In fiscal 2009, the earliest year with comparable data, immigrants without past criminal convictions accounted for the majority (61%) of those arrested by the agency.
Overall, the number of ICE arrests decreased sharply during that span, from 297,898 in 2009 (the year President Barack Obama came into office) to 143,470 in 2017 (when President Donald Trump took office). However, last year’s total represented a 30% increase from the year before, with most of the increase coming after Trump signed an executive order to step up enforcement.
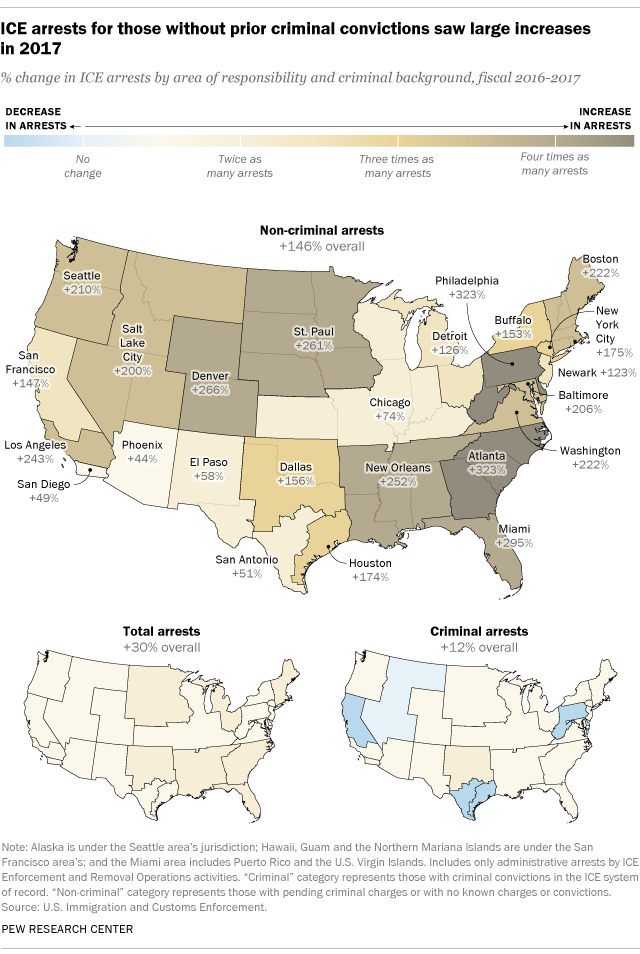
While ICE arrests overall rose from 2016 to 2017, arrests for those without prior convictions drove the increase. The number of arrestees without known convictions increased 146% (up more than 22,000 arrests), compared with a 12% rise among those with past criminal convictions (up nearly 11,000). Still, the bulk of those arrested in 2016 and 2017 had prior convictions.
ICE arrests can happen in a variety of ways. The agency relies on government databases to help track fugitives, and it can detain suspects in courthouses. But in most cases, ICE takes custody of people after local or state police have arrested them.
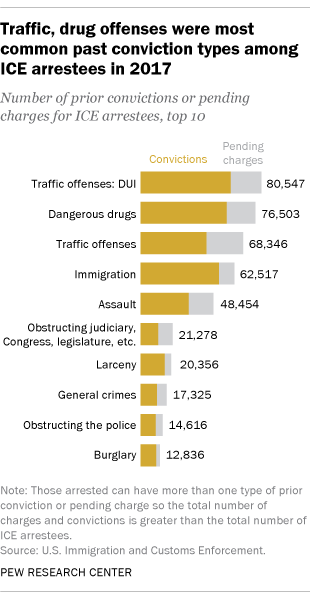
Among ICE arrestees in 2017 with prior convictions, the most common criminal conviction category was driving under the influence of alcohol (59,985 convictions, or 16% of the total), followed by possessing or selling “dangerous drugs” such as opioids (57,438, or 15%). Immigration offenses, which include illegal entry or false claim to U.S. citizenship, were the third-most common crime type (52,128 convictions, or 14%). Those arrested can have more than one type of conviction or pending charge so the total number of charges and convictions is greater than the total number of arrestees; ICE counts an immigrant with a prior criminal conviction and pending criminal charges only in the criminal conviction category.
For ICE arrestees with pending criminal charges in 2017, general traffic offenses topped the list of most common charges (24,438, or 17% of all charges), followed by driving under the influence of alcohol (20,562, or 14%) and possession or selling of “dangerous drugs” (19,065, or 13%). Pending immigration violations were the fifth-most common charge (10,389, or 7%).
Assault ranked among the five most common pending criminal charges and conviction categories for ICE arrestees in 2017, accounting for 11% and 8% respectively. Other violent crime categories were much less common. Sexual assault, kidnapping and homicide each made up 1% or fewer of both pending charges and prior convictions.
This is the first time that ICE has collected and reported detailed pending criminal charge and prior conviction data, so only data for 2017 are available. ICE also only reports criminal charge categories with at least 1,000 total convictions and charges.
ICE arrest patterns vary by region
The share of criminal and non-criminal ICE arrests varies by geography, which the agency reports by “area of responsibility.” While these areas are named for field offices in major cities, they can encompass large swaths of the U.S., with some covering four or more states.
In 2017, nearly nine-in-ten ICE arrests in the Los Angeles area (88%), which covers much of Southern California, were of those with past criminal convictions. This was the highest share of any ICE area of responsibility. In all ICE areas, considerable majorities of arrests were for those with prior convictions; the Newark area (which covers all of New Jersey) was lowest, with 60% criminal arrests.
Yet non-criminal arrests increased at much faster rates than criminal arrests did in all 24 areas of responsibility between 2016 and 2017; in a few areas, criminal arrests even decreased slightly. In the Dallas region – which had the most overall arrests last year (16,520) – non-criminal arrests rose 156%, while criminal arrests went up 61%. The difference was even bigger in the Houston enforcement region, which had the second-highest overall number of arrests (13,565): Non-criminal arrests rose 174%, while criminal arrests fell by 6%. In half of the ICE areas, non-criminal arrests rose 200% or more.