

Ten years ago, as Americans prepared for the winter holidays, few suspected that the U.S. economy was about to enter one of its steepest downturns in living memory. The Great Recession, as it came to be known, began in December 2007 and worsened considerably with the 2008 global financial crisis. Although people’s perceptions of their local job market have improved considerably in recent years, in many ways the U.S. labor force looks very different than it did at the beginning of the recession.
Here are five ways in which the U.S. workforce has changed since the onset of the Great Recession. (It’s worth noting that, in many cases, the slump intensified or accelerated longer-term trends that already were underway. Also, in order to highlight changes, in most cases we compare the most recent available economic data points with those in December 2007, when the economy started its big slowdown.)
A smaller share of Americans are in the labor force. In December 2007, two-thirds (66.0%) of civilians ages 16 and over either were employed or actively looking for work; as of October of this year, only 62.7% were. The labor force participation rate, as it’s called, fell steadily throughout the Great Recession and well into the subsequent recovery. It bottomed out at a seasonally adjusted 62.4% in September 2015 and has risen only slightly since then.
Labor economists generally agree that waves of retiring Baby Boomers explain much, though not all, of the decline. Other possible contributing factors include people spending more years in school, and hence fewer on the job; a decline in demand for less-skilled labor; and what one researcher has called a “flight from work,” especially among men. (An estimated 524,000 jobless Americans last month reported not actively looking for work because they’re discouraged about their employment prospects – more than the 363,000 who reported being discouraged in December 2007, but less than the 1.3 million peak in December 2010.)
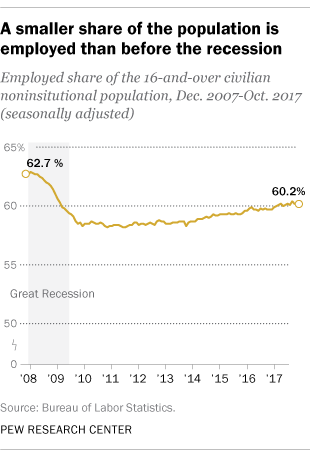
Similarly, the employment-population ratio – the share of the 16-and-over population that’s employed – fell steeply during the recession and recovered very slowly. Last month, that metric stood at a seasonally adjusted 60.2%, 2.5 percentage points below where it was in December 2007. Blacks were particularly hard-hit: The employment-population ratio for blacks ages 16 and older, which before the Great Recession was already well below that of other major racial and ethnic groups, fell more than the ratio for any other group once the downturn hit. Although the black employment-population ratio has risen considerably since, it remains well below the level of other major racial and ethnic groups.
The workforce is getting more diverse. U.S.-born non-Hispanic whites comprised nearly two-thirds of the civilian labor force in December 2007 (65.3%, not seasonally adjusted); as of last month, that subgroup accounted for about 60% of the labor force. The foreign born now account for 17.1% of the U.S. labor force, up from 15.6% in December 2007, with Asian immigrants making up a significant portion of the increase.
The Hispanic share of the labor force has increased from 14.3% in December 2007 to 17.0% as of last month. U.S.-born Hispanics, rather than immigrants, have accounted for most of that growth. While the foreign born were a majority (54.5%) of the Hispanic labor force a decade ago, today 52.0% were born in the United States.
Views of immigrant workers also have shifted over the past decade. In a 2016 Pew Research Center survey, 42% of Americans said the growing number of immigrants working in this country helps, not hurts, U.S. workers, up from 28% in 2006. But there were sharp partisan divides: Between 2006 and 2016, there was a 28-point increase in the share of Democrats saying that the growing number of immigrants working in the country helps, while Republicans became slightly more likely to say the change hurts American workers.
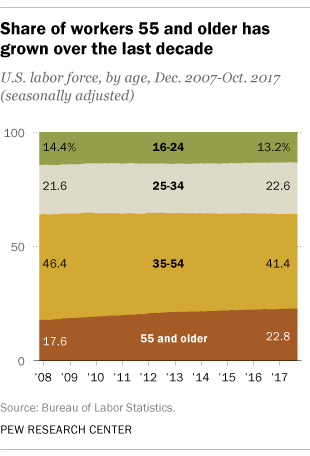
There’s more gray in the workforce. Americans ages 55 and older make up more than a fifth of the total labor force today (22.8%, seasonally adjusted), compared with 17.6% at the start of the Great Recession. Over the past decade, in fact, labor force participation has risen only among the 55-and-older contingent – from a seasonally adjusted 38.9% in December 2007 to 39.8% last month. (That continued a trend that began in the mid-1990s, though for the past eight years the 55-and-older participation rate has been fairly level.) As the population has aged and participation rates have fallen for people in their prime working years, 35- to 54-year-olds now account for just 41.4% of the labor force (seasonally adjusted), down from 46.4% in December 2007.
Unemployed people are out of work for longer. After soaring as high as 10.0% in October 2009, the overall unemployment rate has ratcheted down to a seasonally adjusted 4.1%, its lowest level since 2000. However, not only is a smaller share of the adult population in the active labor force, but people who are unemployed are more likely to stay jobless for longer. (Quick reminder: The government data only count you as “unemployed” if you don’t have a job and have actively looked for one in the past four weeks and are currently available for work.)
Of the 6.2 million Americans (not seasonally adjusted) who were officially considered unemployed in October, more than 1 million (16.5%) had been out of work for a year or more. In December 2007, only 9.1% of unemployed people had been jobless for 52 weeks or more; in April 2011, nearly a third were (32.8%).
In all, the mean number of weeks of reported unemployment (seasonally adjusted) was 26.0 in October, versus 16.6 in December 2007. The median number of weeks without work was 9.9, compared with 8.4 weeks a decade ago.
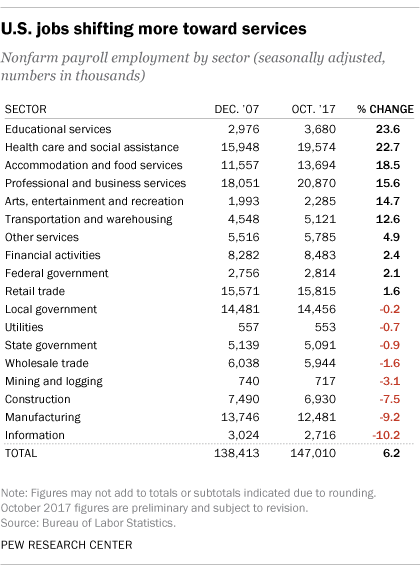
The shift toward service jobs continues, though more slowly. Today, 83.9% of all private-sector nonfarm jobs are classified as service-providing, up from 81.1% a decade ago, while the share of jobs in goods-producing sectors – mining, logging, construction and manufacturing – fell from 18.9% in December 2007 to 16.1% in October. The service sector’s relative share grew rapidly from 2007 to early 2010, as the economy shed thousands of construction and manufacturing jobs in the wake of the collapse of the housing bubble, but has grown only slowly since.
The number of goods-producing private-sector jobs has fallen by 1.8 million since December 2007; over that same period, the economy added 10.5 million service-sector jobs. The health care and social assistance sector was the biggest single contributor to that growth, adding 3.6 million jobs for a gain of 22.7%. Professional and business services gained 2.8 million jobs, while accommodation and food services added 2.1 million. On the other hand, there were 1.3 million fewer manufacturing jobs in October than there were at the start of the recession (although the sector has added 1 million jobs since bottoming out in early 2010).
A 2016 Pew Research Center analysis found that the job categories with the highest growth over the past several decades tend to require higher social skills, analytic savvy and technical prowess. This reality is not lost on U.S workers, the vast majority of whom say new skills and training may hold the key to their future job success.
