
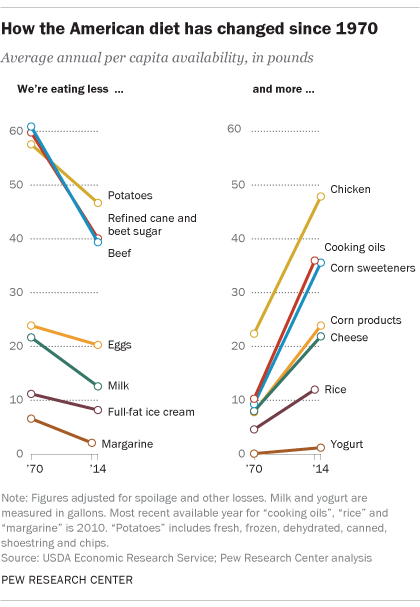
Americans eat more chicken and less beef than they used to. They drink less milk – especially whole milk – and eat less ice cream, but they consume way more cheese. Their diets include less sugar than in prior decades but a lot more corn-derived sweeteners. And while the average American eats the equivalent of 1.2 gallons of yogurt a year, he or she also consumes 36 pounds of cooking oils – more than three times as much as in the early 1970s.
Americans’ eating habits, in short, are all over the place, at least according to our analysis of U.S. Department of Agriculture (USDA) data. Which is about what you’d expect, judging from the results of Pew Research Center’s recent survey on food and nutrition attitudes. In that survey, 54% of Americans said people in the U.S. pay more attention to eating healthy foods today compared with 20 years ago – the same percentage who said Americans’ actual eating habits are less healthy today than they were 20 years ago. And while 73% of Americans said they were very or fairly focused on healthy and nutritious eating, 58% said that most days they probably should be eating healthier.
So how do Americans really eat, and how has that changed over time? We analyzed data from the USDA’s Food Availability (Per Capita) Data System, or FADS, to find out. (Specifically, we used food availability adjusted for waste, spoilage and other loss as a proxy for consumption.) While the nation’s eating habits don’t change all that much from year to year, looking at them over 40 or more years shows some significant changes.
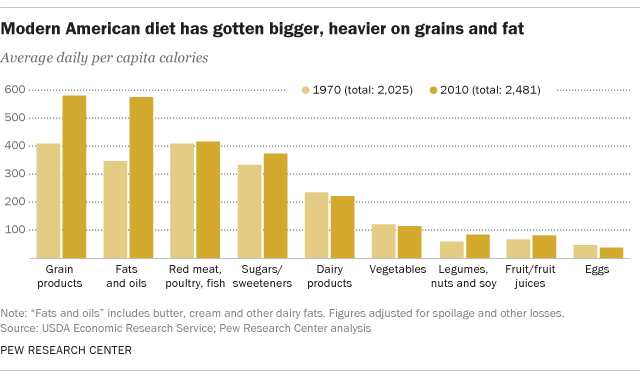
Broadly speaking, we eat a lot more than we used to: The average American consumed 2,481 calories a day in 2010, about 23% more than in 1970. That’s more than most adults need to maintain their current weight, according to the Mayo Clinic’s calorie calculator. (A 40-year-old man of average height and weight who’s moderately active, for instance, needs 2,400 calories; a 40-year-old woman with corresponding characteristics needs 1,850 calories.)
Nearly half of those calories come from just two food groups: flours and grains (581 calories, or 23.4%) and fats and oils (575, or 23.2%), up from a combined 37.3% in 1970. Meats, dairy and sweeteners provide smaller shares of our daily caloric intake than they did four decades ago; then again, so do fruits and vegetables (7.9% in 2010 versus 9.2% in 1970).
Most of the fats we consume are in the form of vegetable oils: soybean, corn, canola and other oils used as ingredients or in which foods are cooked. Such oils contributed 402 calories on their own to our daily diet in 2010 (although the Center for Science in the Public Interest, in its analysis of the USDA data, notes that the increase in fat consumption may not be as steep as it appears, because the number of manufacturers reporting data jumped suddenly in 2000).
While butter consumption, at 3.3 pounds per person per year, is about the same as it was in 1970, margarine use has fallen dramatically, from a peak of 7.2 pounds per person per year in 1976 to 2.1 pounds in 2010. (In 2011 the Census Bureau discontinued the report USDA relied on to make most of its fat and oil estimates, though the department has been developing a replacement. That’s also why overall calorie-consumption estimates aren’t available past 2010.)
Several interesting shifts are happening within food groups. For the past decade, for instance, chicken has topped beef as the most-consumed meat. In 2014, Americans ate an average of 47.9 pounds of chicken a year (2.1 ounces a day), versus 39.4 pounds (1.7 ounces a day) of beef. While average chicken consumption has more than doubled since 1970, beef has fallen by more than a third.
Over in the dairy aisle, Americans are drinking 42% less milk than they did in 1970: 12.6 gallons a year, equivalent to 4.8 ounces a day. However, we’re eating a lot more cheese: 21.9 pounds a year, nearly three times the average annual consumption in 1970. And yogurt has soared in popularity, from negligible levels in 1970 to almost 1.2 gallons per person per year in 2014 – a 1,700% increase.
Americans consume 29% more grains, mostly in the form of breads, pastries and other baked goods, than they did in 1970 – the equivalent of 122.1 pounds a year. But that’s actually down from 2000, the year of “peak grain,” when per capita annual consumption was a hefty 137.6 pounds. While corn products are a somewhat bigger part of the average American diet (14 pounds per person per year, up from 4.9 pounds in 1970), wheat is still the country’s staple grain.
America’s sweet tooth peaked in 1999, when each person consumed an average of 90.2 pounds of added caloric sweeteners a year, or 26.7 teaspoons a day. In 2014, sweetener use was down to 77.3 pounds per year, or 22.9 teaspoons a day. (Note that those figures don’t include noncaloric sweeteners, such as aspartame, sucralose and stevia.) While most of the sweetener consumed in 1970 was refined sugar, the market is now almost evenly split between sugar and corn-derived sweeteners, such as high-fructose corn syrup.
