
Women, Work and Caregiving Through the Arc of Family Life

Gender, work and caregiving are often woven together in family life in the United States. Most parents with children under 18 are employed. And as the population ages, a growing share of Americans are caring for an older parent. In fact, many U.S. adults are sandwiched in between roles, supporting both children and parents.
When we begin to focus on the challenges that come with balancing family caregiving and work responsibilities, the disproportionate burden that falls on women stands out.
Women have made clear gains in the workforce in just a couple of generations: They’ve made inroads into management and leadership positions, and their earning power has grown. At the same time, many have maintained the position of default caregiver within their family unit, even while they are working full time. This has made it difficult for women collectively to reach parity with men at home or in the workplace.
Trends in employment and earnings
Women streamed into the U.S. labor force in the 1970s and 1980s, but their participation leveled off around 1990 and has stayed remarkably stable since then. Women remain less likely to be in the labor force than men. The stability is especially notable when you consider the gains women have made in higher education in recent decades, outpacing men in college completion.
Today the gap in labor force participation between women and men is 9 percentage points. The gap between women and men with children is much wider. In 2025, 74% of women with children under 18 were working or looking for work, compared with 94% of men with children.
Once family caregiving becomes a part of the equation, men’s and women’s work experiences – including their wages – start to diverge.

| Year | Wage gap | Men’s wages | Women’s wages |
|---|---|---|---|
| 1982 | 65% | 100% | 65% |
| 1983 | 67% | 100% | 67% |
| 1984 | 68% | 100% | 68% |
| 1985 | 67% | 100% | 67% |
| 1986 | 68% | 100% | 68% |
| 1987 | 69% | 100% | 69% |
| 1988 | 70% | 100% | 70% |
| 1989 | 72% | 100% | 72% |
| 1990 | 75% | 100% | 75% |
| 1991 | 77% | 100% | 77% |
| 1992 | 77% | 100% | 77% |
| 1993 | 77% | 100% | 77% |
| 1994 | 78% | 100% | 78% |
| 1995 | 78% | 100% | 78% |
| 1996 | 78% | 100% | 78% |
| 1997 | 78% | 100% | 78% |
| 1998 | 80% | 100% | 80% |
| 1999 | 77% | 100% | 77% |
| 2000 | 78% | 100% | 78% |
| 2001 | 79% | 100% | 79% |
| 2002 | 80% | 100% | 80% |
| 2003 | 81% | 100% | 81% |
| 2004 | 80% | 100% | 80% |
| 2005 | 83% | 100% | 83% |
| 2006 | 82% | 100% | 82% |
| 2007 | 82% | 100% | 82% |
| 2008 | 82% | 100% | 82% |
| 2009 | 82% | 100% | 82% |
| 2010 | 83% | 100% | 83% |
| 2011 | 85% | 100% | 85% |
| 2012 | 83% | 100% | 83% |
| 2013 | 83% | 100% | 83% |
| 2014 | 83% | 100% | 83% |
| 2015 | 83% | 100% | 83% |
| 2016 | 83% | 100% | 83% |
| 2017 | 82% | 100% | 82% |
| 2018 | 85% | 100% | 85% |
| 2019 | 85% | 100% | 85% |
| 2020 | 84% | 100% | 84% |
| 2021 | 85% | 100% | 85% |
| 2022 | 82% | 100% | 82% |
| 2023 | 88% | 100% | 88% |
| 2024 | 85% | 100% | 85% |
| 2025 | 86% | 100% | 86% |
| Year | Women ages 25 to 34 in 2000 | Women ages 25 to 34 in 2005 | Women ages 25 to 34 in 2010 | Women ages 25 to 34 in 2015 |
|---|---|---|---|---|
| 2000 | 86% | |||
| 2001 | 86% | |||
| 2002 | 83% | |||
| 2003 | 87% | |||
| 2004 | 84% | |||
| 2005 | 84% | 89% | ||
| 2006 | 83% | 90% | ||
| 2007 | 82% | 88% | ||
| 2008 | 82% | 87% | ||
| 2009 | 80% | 86% | ||
| 2010 | 82% | 89% | 93% | |
| 2011 | 82% | 85% | 94% | |
| 2012 | 79% | 84% | 91% | |
| 2013 | 80% | 85% | 90% | |
| 2014 | 82% | 85% | 88% | |
| 2015 | 82% | 83% | 87% | 90% |
| 2016 | 80% | 82% | 87% | 89% |
| 2017 | 80% | 82% | 84% | 88% |
| 2018 | 78% | 82% | 84% | 88% |
| 2019 | 80% | 80% | 80% | 88% |
| 2020 | 77% | 78% | 81% | 87% |
| 2021 | 78% | 82% | 85% | 88% |
| 2022 | 82% | 82% | 84% | 89% |
| 2023 | 83% | 83% | 83% | 87% |
| 2024 | 80% | 82% | 83% | 85% |
| 2025 | 79% | 80% | 83% | 85% |

| Year | Husband primary or sole breadwinner | Egalitarian | Wife primary or sole breadwinner |
|---|---|---|---|
| 1972 | 85 | 11 | 5 |
| 1982 | 77 | 16 | 8 |
| 1992 | 66 | 22 | 12 |
| 2002 | 62 | 25 | 13 |
| 2012 | 59 | 23 | 17 |
| 2022 | 55 | 29 | 16 |

| Husband | Wife | |
|---|---|---|
| Leisure | 25.2 | 21.6 |
| Caregiving | 5.1 | 6.9 |
| Housework | 1.9 | 4.6 |

| At work | At home | Both equally | |
|---|---|---|---|
| Men | 57 | 7 | 35 |
| Women | 20 | 31 | 49 |
Balancing work and parenting
| Parents | |
|---|---|
| Give 100% at home | 58 |
| Give 100% at work | 46 |
| Fathers | Mothers | |
|---|---|---|
| Give 100% at home | 50 | 67 |
| Give 100% at work | 38 | 56 |

| % | |
|---|---|
| Men | 38 |
| Women | 52 |

| Type | Working parents |
|---|---|
| Work from home all/most of the time | 52 |
| Work from home some of the time | 54 |
| Rarely/never work from home | 54 |
| Working parents | |
|---|---|
| Would be helpful to them | 84 |
| Is available to them | 50 |
Parenting young adult children
| Parents of young adults | |
|---|---|
| Their children rely on them for emotional support | 41 |
| They helped their children financially in the past year | 59 |
| Fathers | Mothers | |
|---|---|---|
| Send text messages | 63 | 81 |
| Talk on the phone or video chat | 46 | 61 |

Caring for aging family members
| % | |
|---|---|
| Men | 23 |
| Women | 28 |

| Men | Women | |
|---|---|---|
| Physical health | 9 | 20 |
| Emotional well-being | 22 | 40 |
| Financial situation | 22 | 36 |

| Men | Women | |
|---|---|---|
| Emotional well-being | 16 | 33 |
| Social life | 15 | 29 |
| Financial situation | 9 | 20 |

| U.S. adult caregivers | |
|---|---|
| Giving tax credits to help pay for caregiving | 77 |
| Paying for short-term care for aging adults to give family caregivers a break | 73 |
| Requiring employers to provide paid family leave | 67 |
| Giving direct payments to help with caregiving costs | 66 |
There’s a persistent gender wage gap that’s explained, at least in part, by family caregiving responsibilities. Overall, women earn about 86 cents for every dollar earned by men. The gap in median hourly earnings between men and women narrowed significantly starting in the early 1980s until around 2000. Since then, it’s remained fairly stable.
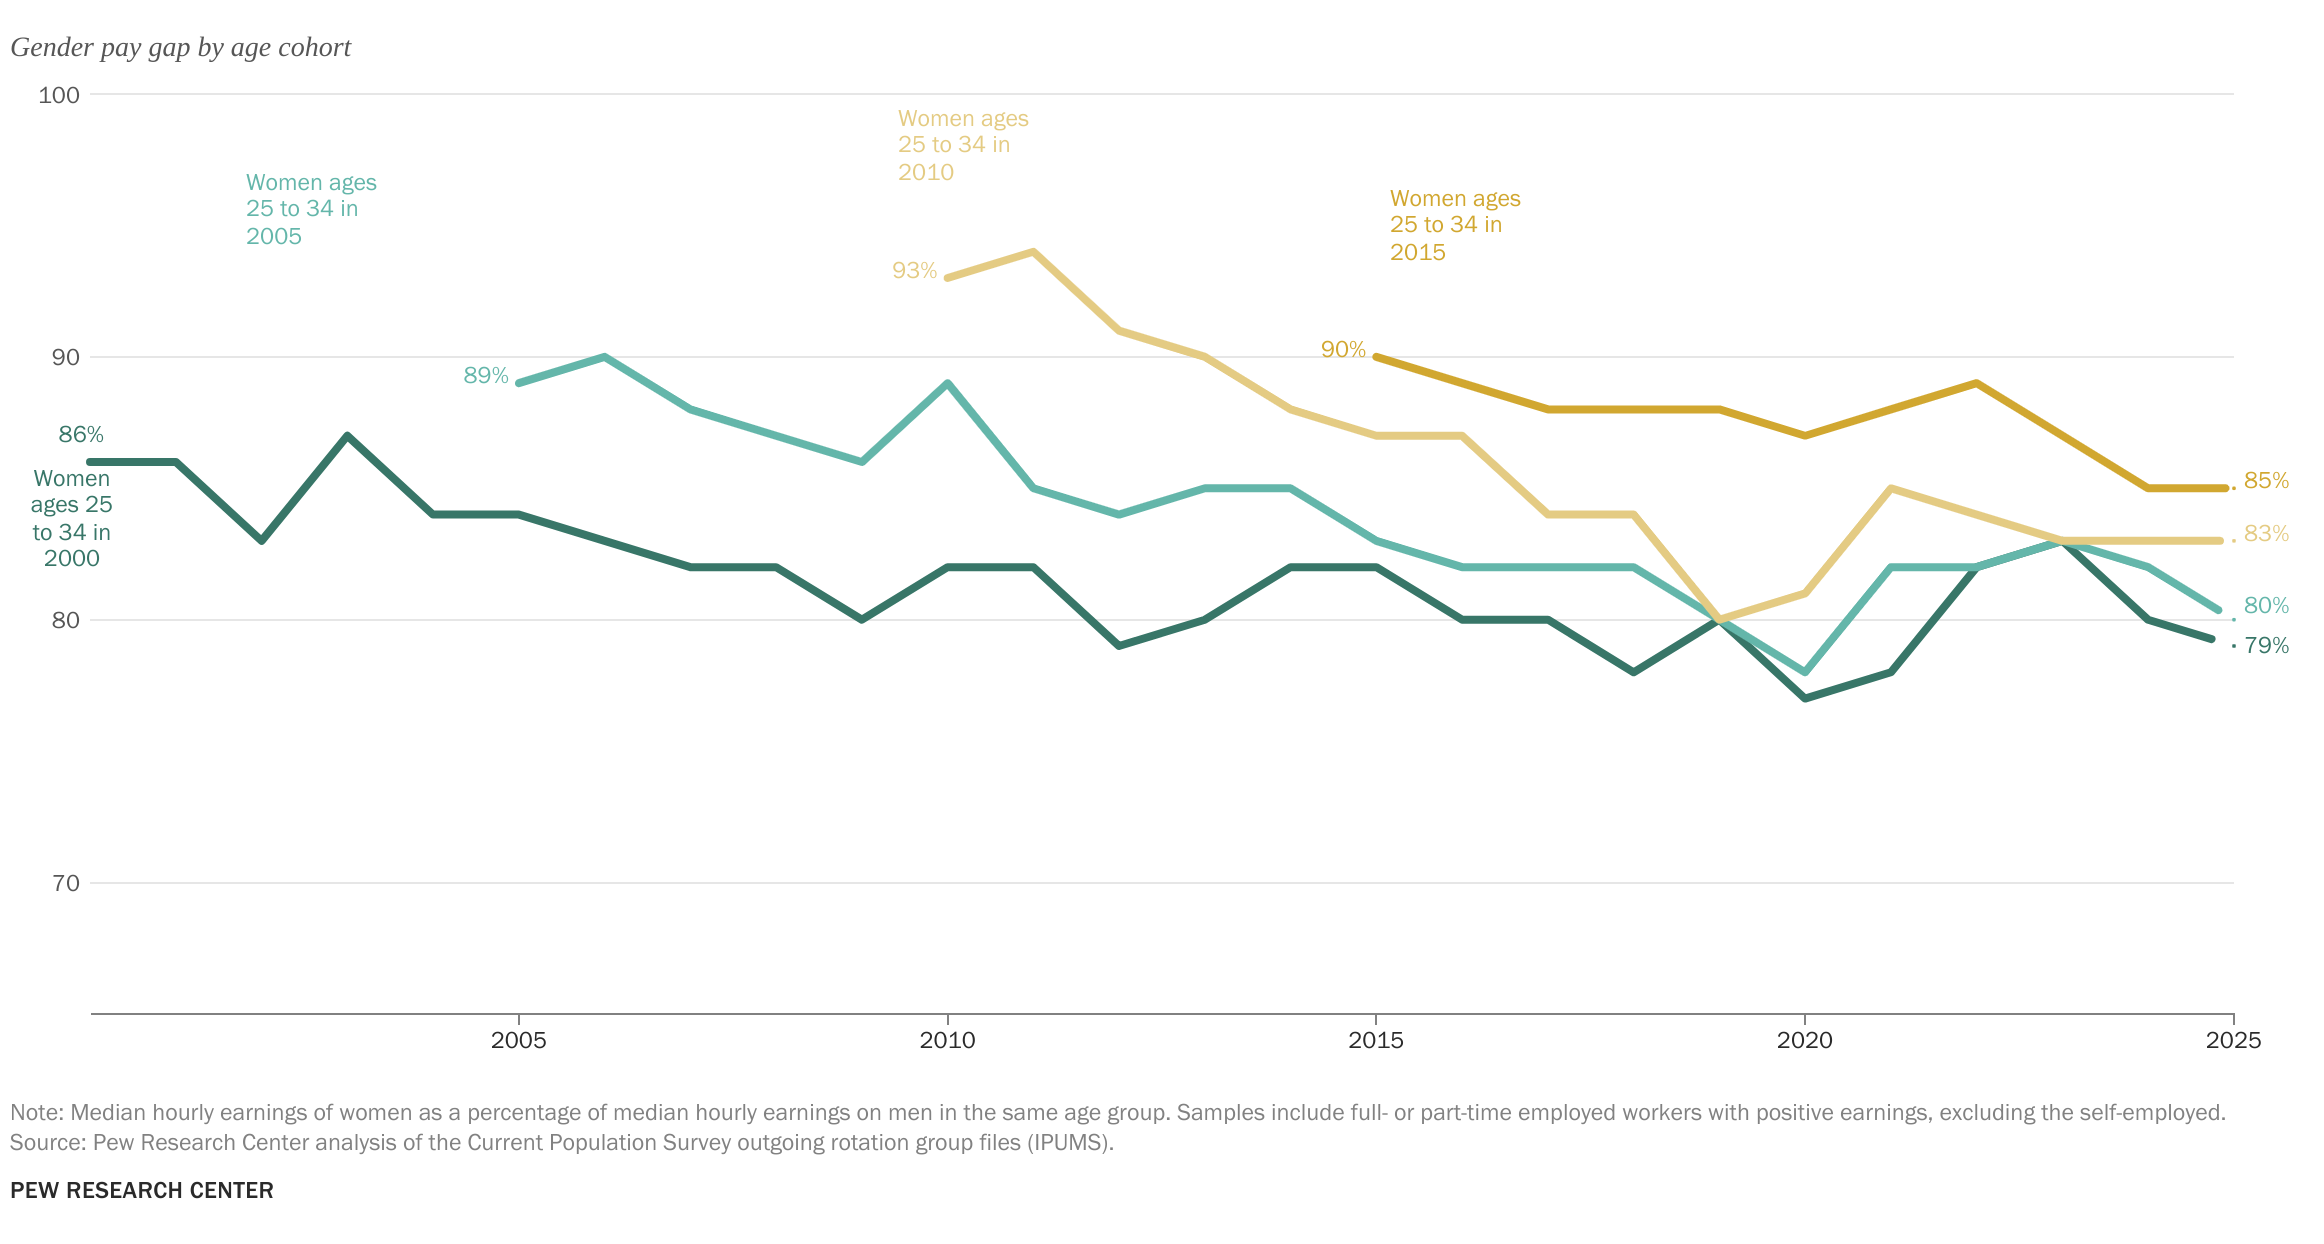
When you break the data down further and look at groups of young women who have entered the labor force over the past 25 years, you can see that there’s been progress and then regress. For the most part, each group of young women has entered the workforce in a stronger position relative to men than the cohort who came before them.
But about five to 10 years into their work life – around the time many women start to take on family caregiving responsibilities – each group starts to lose ground relative to men. They all tend to coalesce around the same point. For example, women who were ages 25 to 34 in 2015 were earning 90% of what men the same age were earning. By 2025, these women were earning 85%.
Still, there’s no doubt that women have gained economic clout over recent decades, despite the overall gender wage gap. Looking at earnings dynamics within married couples, the once-dominant arrangement of the husband as the primary or sole breadwinner is no longer as common as it was in the past. The share of marriages where the husband and wife earn about the same amount of money has roughly tripled to 29% over the past 50 years, as has the share of couples where the wife is the sole or primary breadwinner (now at 16%).
For the growing number of wives in egalitarian marriages, the division of labor at home doesn’t necessarily reflect their shared financial contribution. Women in these marriages are doing more of the caregiving and housework than their husbands, while men are spending more time on leisure.
This imbalance may reflect underlying public views about gender roles. When we asked Americans what they think society values more in men and women – their contributions at home or at work – there’s a clear difference. A 57% majority say society values men’s contributions at work more than their efforts at home. Only 20% say the same about women.
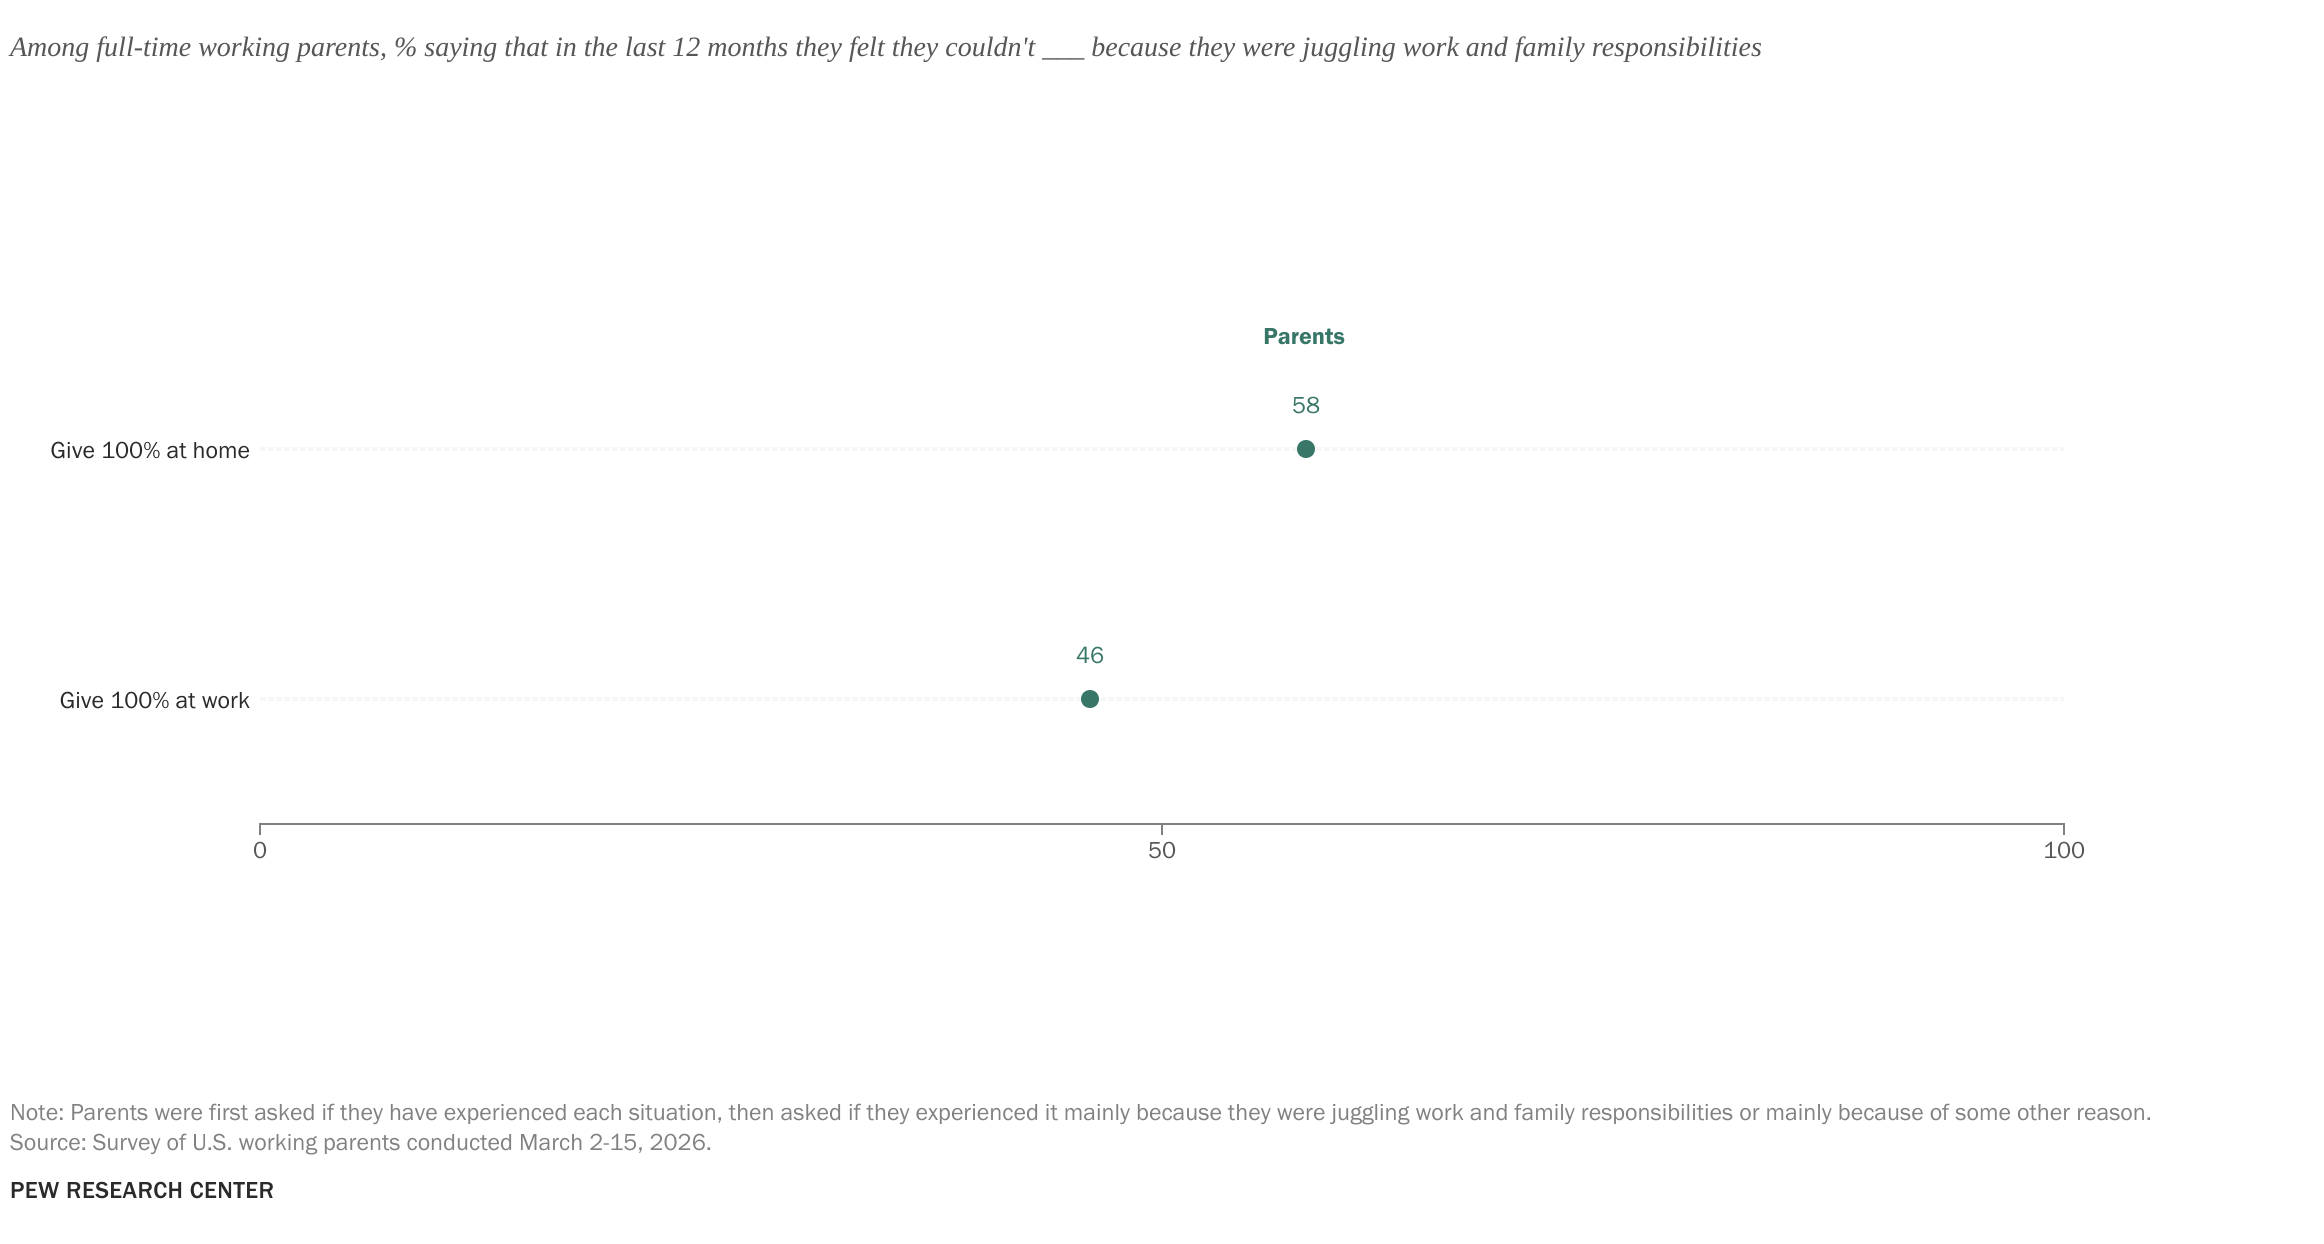
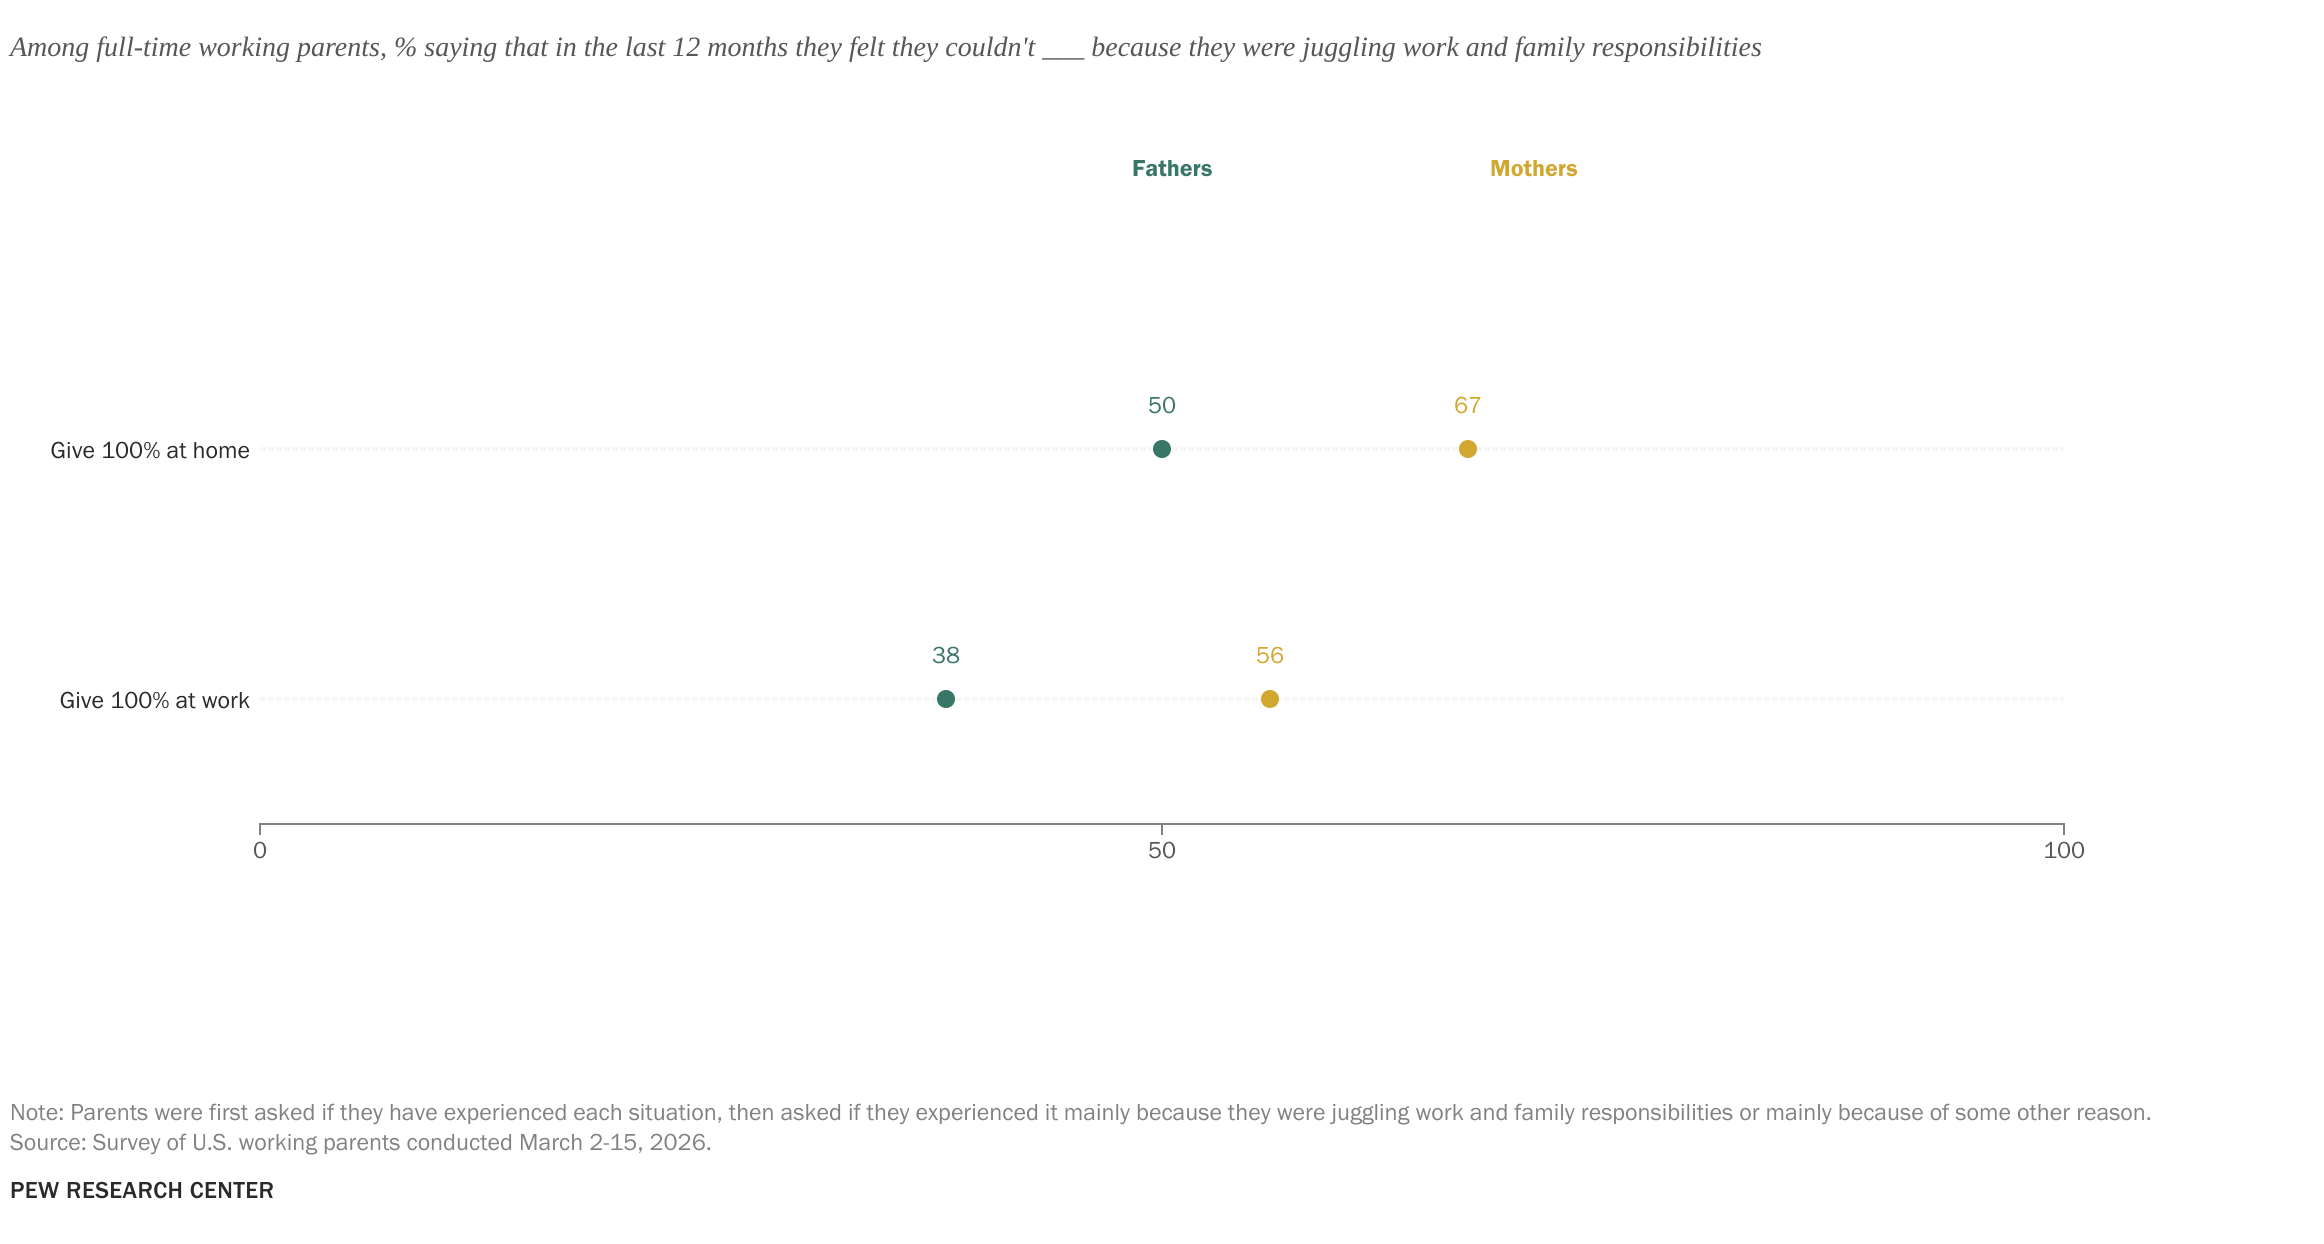
How does this play out in the lives of ordinary Americans? In a recent survey, many working parents told us that, in the last 12 months, they felt like they couldn’t give 100% at home or at work because they were balancing work and family responsibilities.
Those feelings were more pronounced among full-time working mothers than fathers, though substantial shares of fathers expressed these views. Overall, 67% of mothers and 50% of fathers said they couldn’t give their all at home, while 56% of mothers and 38% of fathers said the same about work.
Why do they feel this way? It may be because work often bleeds in family life, and vice versa. Majorities of full-time working mothers and fathers tell us they take care of parenting tasks while they’re at work – or work tasks while they’re with their children – at least sometimes. About half say their job makes it harder to be a good parent. Once again, moms are more likely than dads to say these things.
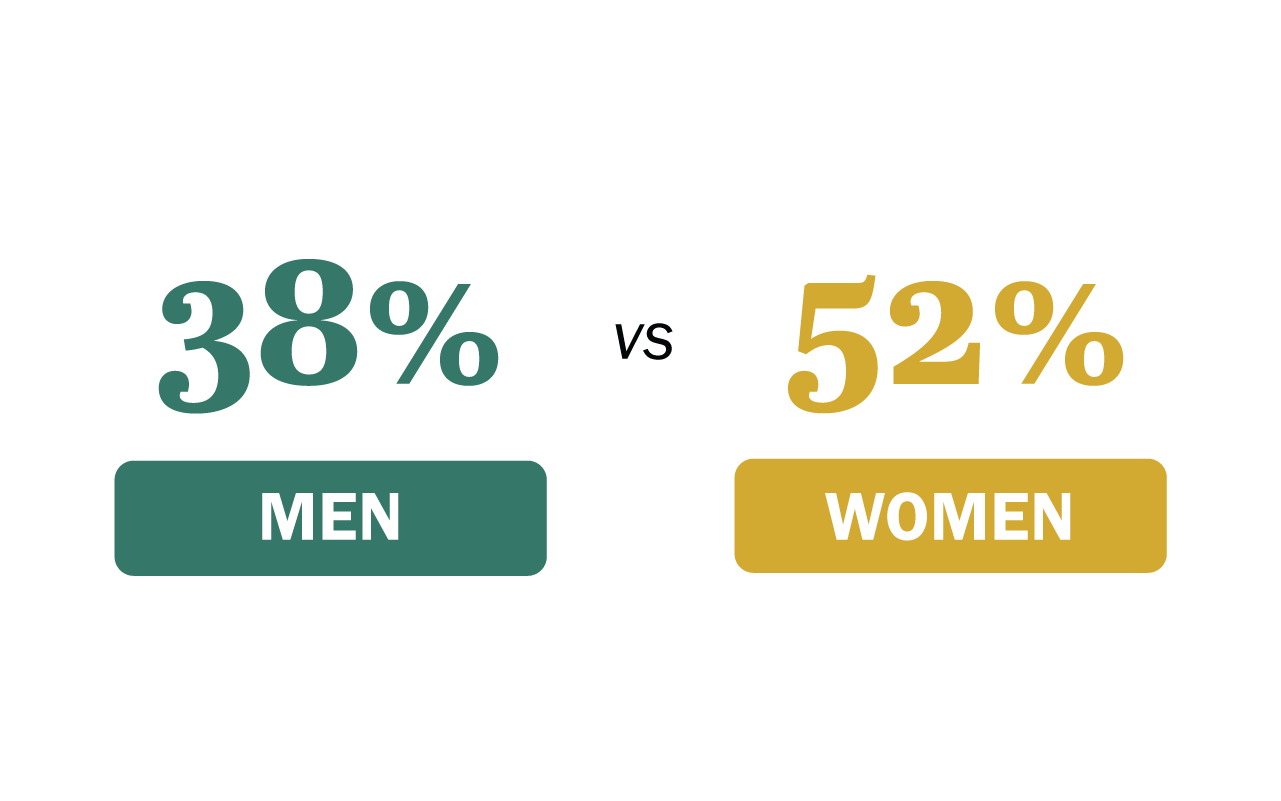
Moms are also more likely than dads to say being a parent makes it harder for them to advance at work. About half (52%) of full-time working moms say this, compared with 38% of full-time working dads.
The challenges of balancing work and family life haven’t necessarily gotten easier as many parents have been able to shift to remote work in recent years. Similar shares of working parents who do their job from home all or most of the time, some of the time, or rarely or never say it’s difficult for them to balance work and family life.
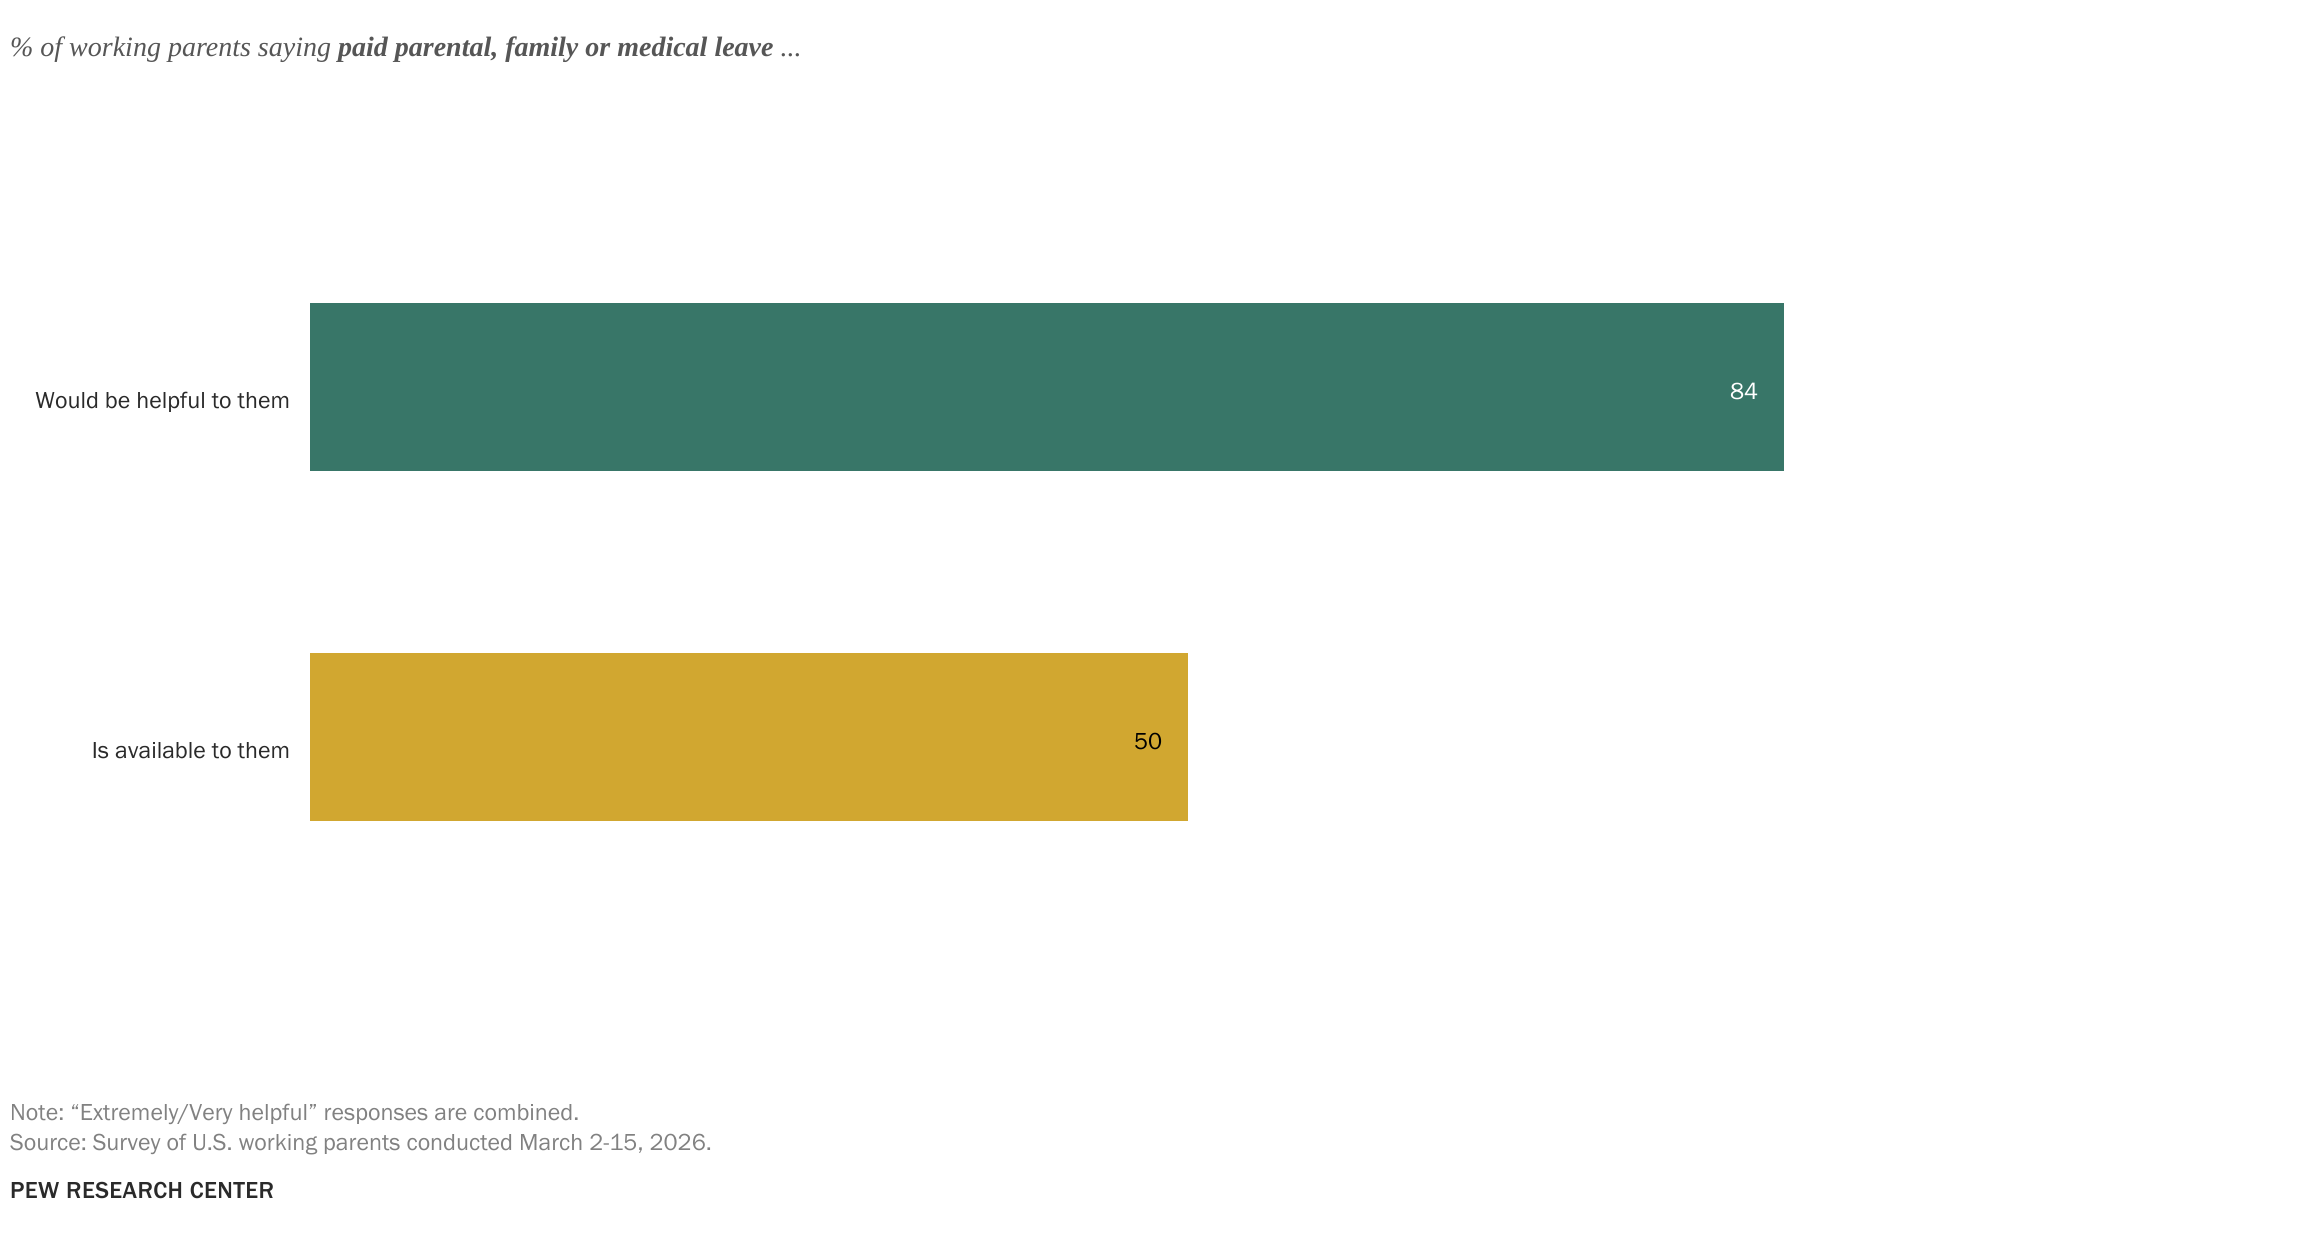
We asked parents what work arrangements or employer-provided benefits would be helpful to them and whether they have access to those policies. And we found large gaps.
More than eight-in-ten working parents say having paid parental, family or medical leave would be helpful for them – but only half say they have access to this at their current job. Similarly, when we asked about the flexibility to decide when and where to work, and about workplace childcare, larger shares of parents say these things would be helpful to them than actually have access to them.
So, what does life look like for parents when their kids aren’t kids anymore? We did a separate survey of parents with young adult children and explored, among other things, how intertwined their lives are with one another.
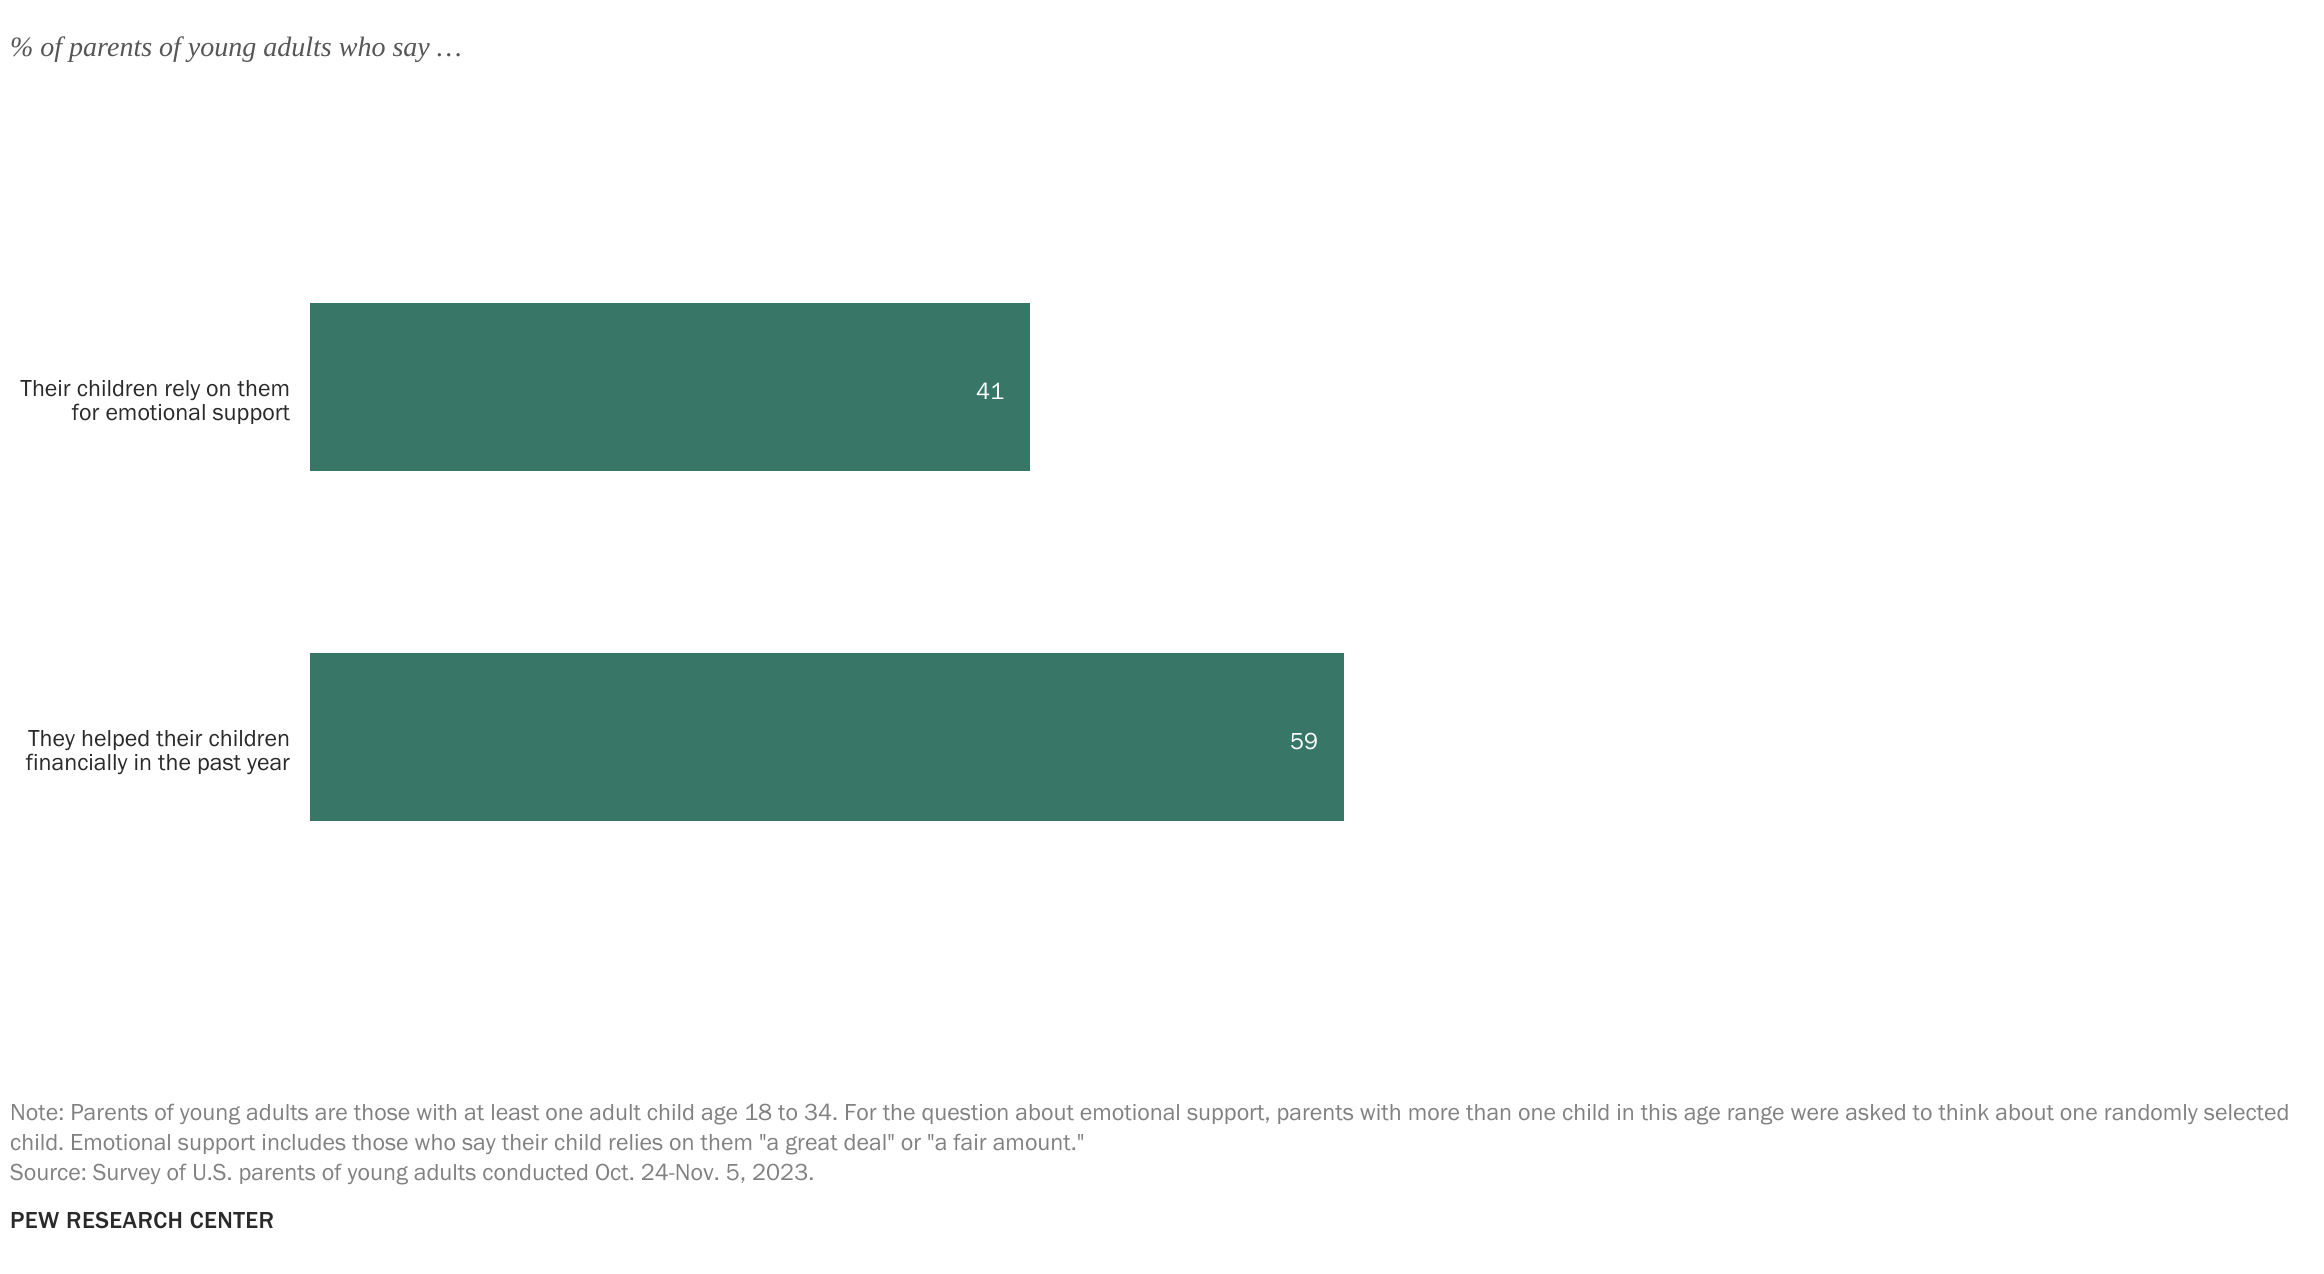
About four-in-ten parents with children ages 18 to 34 say their kids rely on them for emotional support. And an even higher share (59%) say they’ve helped their adult children financially in the past year.
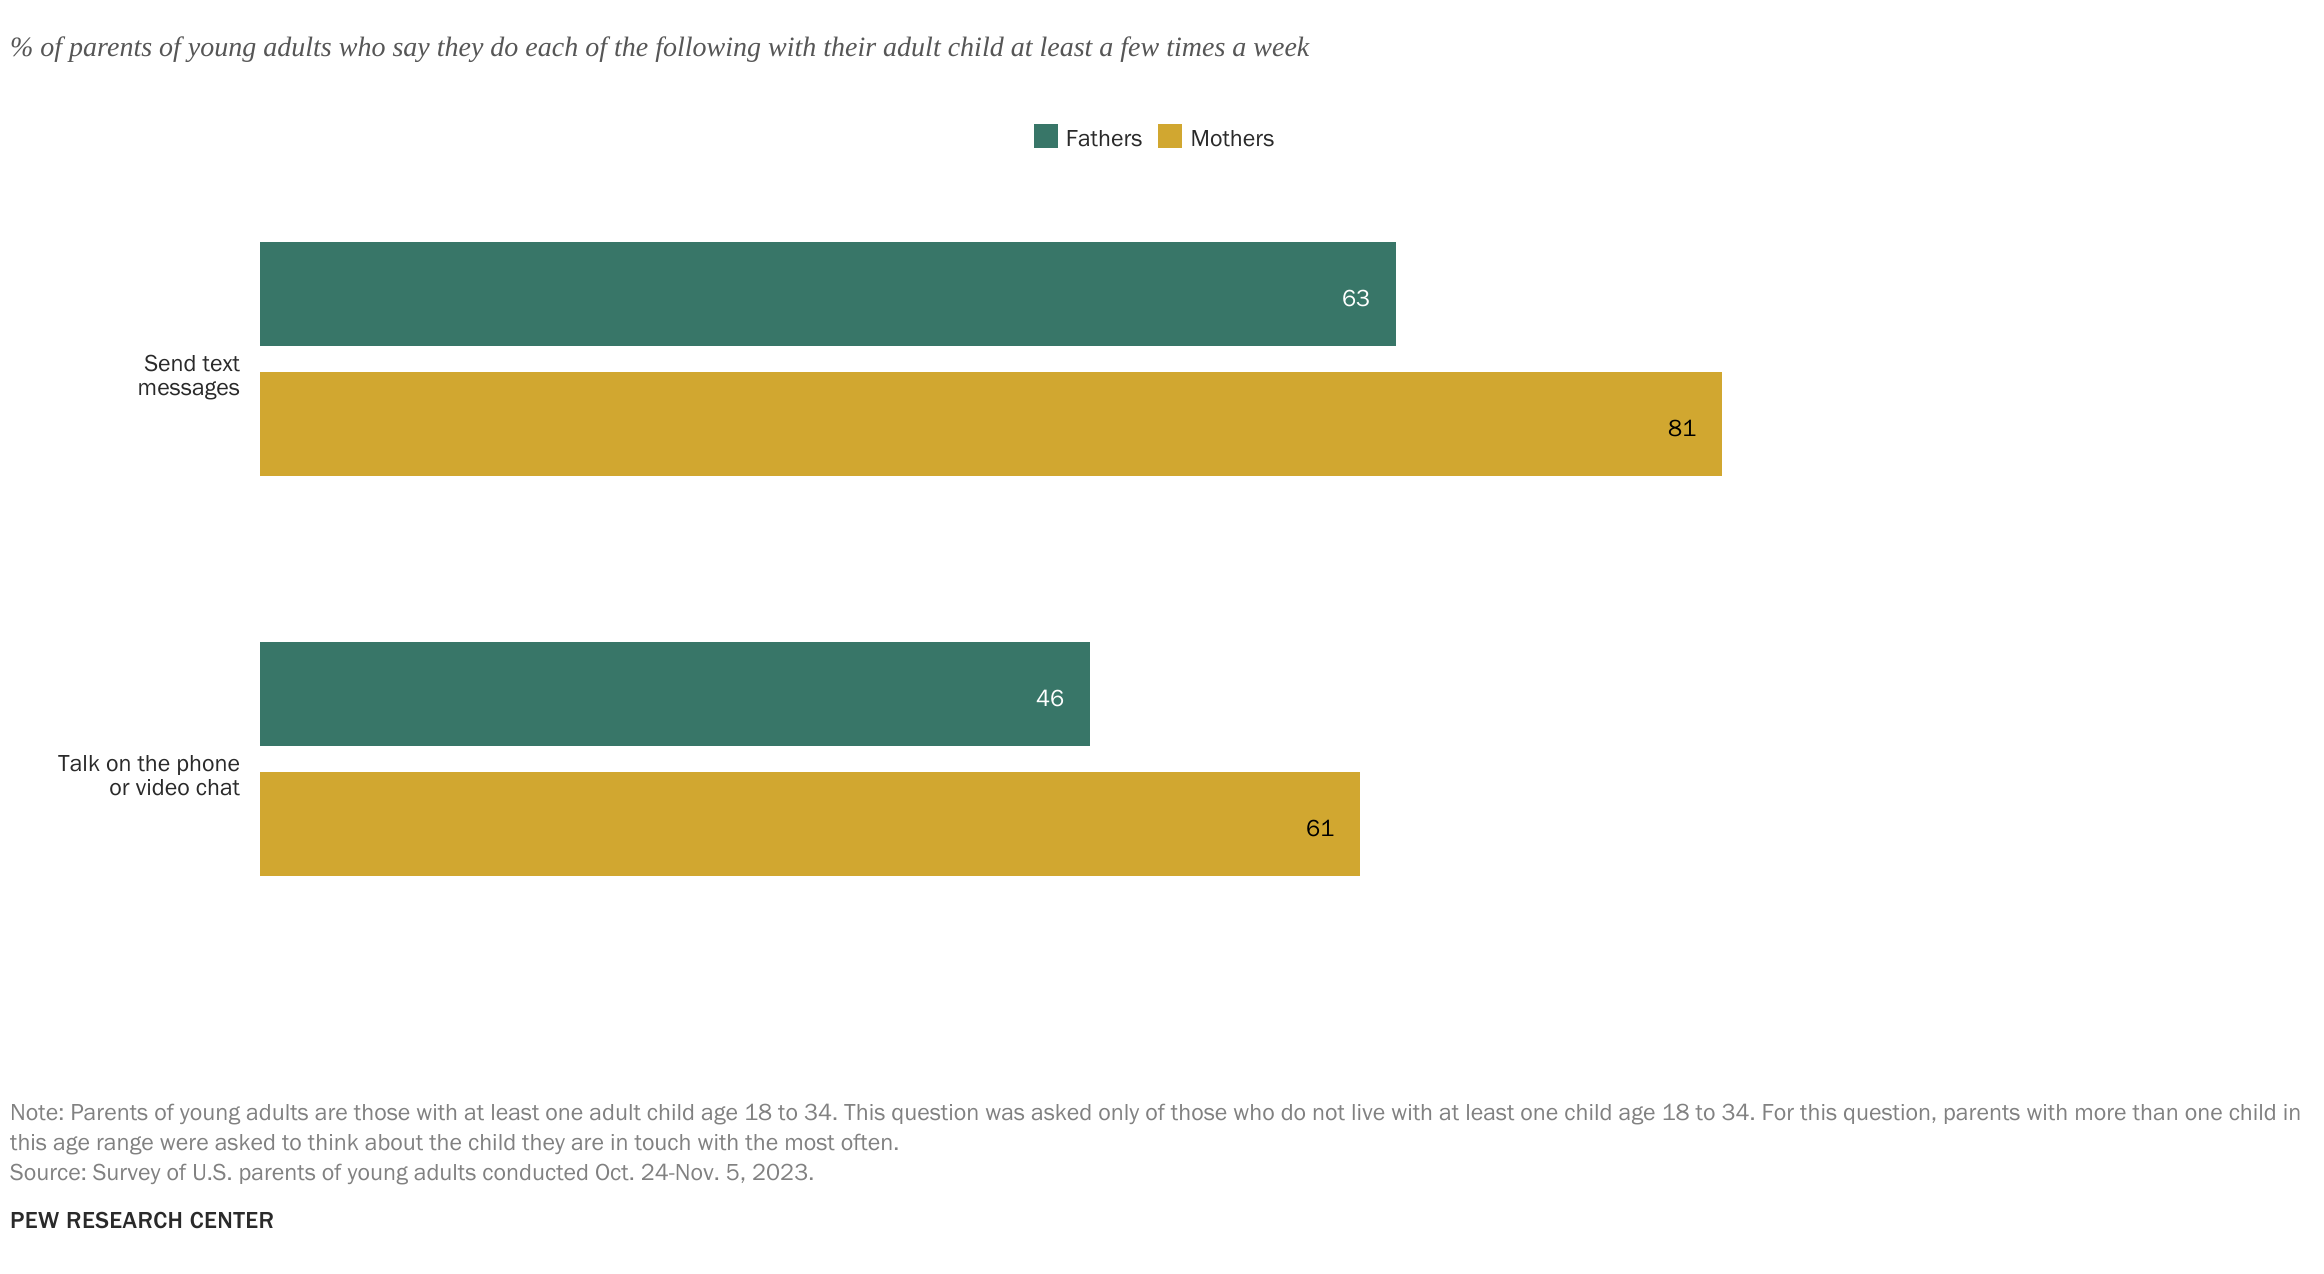
We also asked how often parents are in contact with their young adult children. Here we see a significant gender gap, with moms much more likely than dads to be in contact multiple times a week. For example, 81% of moms say they text with their young adult child at least a few times a week, compared with 63% of dads.
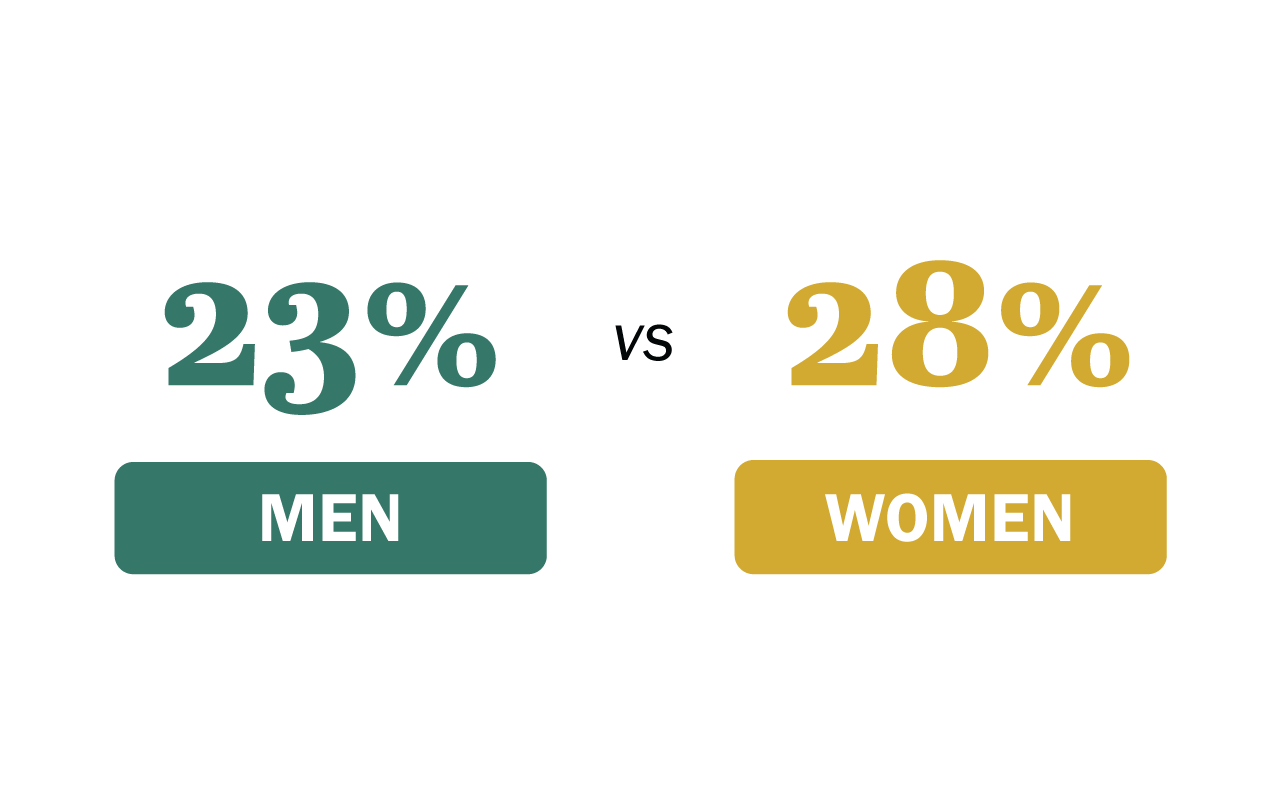
The final chapter in this story of family caregiving is providing support for aging family members. Among adults who have a parent, spouse or partner age 65 or older, 28% of women and 23% of men say they are a caregiver for that person.
Many of these caregivers also balance this role with their work responsibilities. Among working adults who are providing care for an aging parent, majorities of men and women alike say this has had a positive impact on their relationship with that parent.
But women are more likely than men to say this has had a negative impact on their physical health, their emotional well-being and their financial situation. For example, 40% of full-time working women who regularly help an aging parent say playing this role has negatively impacted their emotional well-being. That compares with 22% among full-time working men.
Caring for an aging spouse also lands differently on men and women. Women are more likely to say playing this role negatively impacts their emotional well-being, their social life and their financial situation.
There’s broad support among these family caregivers for government policies that would provide some relief. Majorities of those who consider themselves a caregiver for an aging parent, spouse or partner support giving tax credits to help pay for caregiving, paying for short-term care for aging adults to give family caregivers a break, requiring employers to provide paid family leave, and giving direct payments to help with caregiving costs.
Read more of the Center’s research on gender and work and family life.