

Women now make up 35% of workers in the United States’ 10 highest-paying occupations – up from 13% in 1980. They have increased their presence in almost all of these occupations, which include physicians, lawyers and pharmacists.
Pew Research Center conducted this analysis to learn more about women’s representation in high-paying U.S. occupations as part of our ongoing research into gender and the workplace. This analysis focuses specifically on the 10 highest-paying occupations. Combined, only about 3% of all U.S. workers are employed in these occupations.
The employment analysis uses data from the decennial census and the American Community Survey (ACS). The ACS is the largest household survey in the United States, with a sample of more than 3 million addresses. Collected by the U.S. Census Bureau since 2001, it covers the topics previously included in the long form of the decennial census. The ACS is designed to provide estimates of the size and characteristics of the nation’s resident population.
The microdata files used for this analysis are from the Integrated Public Use Microdata Series (IPUMS) from the University of Minnesota. IPUMS standardizes variable names and coding across years as much as possible, making it easier to analyze data over time.
Consistent data on the employment of chief executives and public administrators is not available before 2000. The 10 highest paid occupations were identified on the basis of median earnings in the 2021 ACS. The earnings of employed Americans ages 16 and older in the civilian non-institutionalized population were analyzed. The occupational classification used the IPUMS variable OCC1990.
The Bureau of Labor Statistics’ Occupational Outlook Handbook specifies the typical entry-level education required for employment in an occupation.
The shares of women receiving degrees in various fields each academic year are based on the Integrated Postsecondary Education Data System (IPEDS) from the National Center for Education Statistics. Most of the data on degrees conferred is available in published tables in the Digest of Education Statistics. The shares of women obtaining Doctor of Pharmacy degrees for academic years 1980 to 2009 can be found in the American Journal of Pharmaceutical Education. Women’s share among Doctor of Pharmacy recipients only includes those who earned Pharm.D. 1 degrees – Doctor of Pharmacy degrees awarded as the first professional degree. The share does not include those who earned Ph.D.s or Pharm.D. 2 degrees.
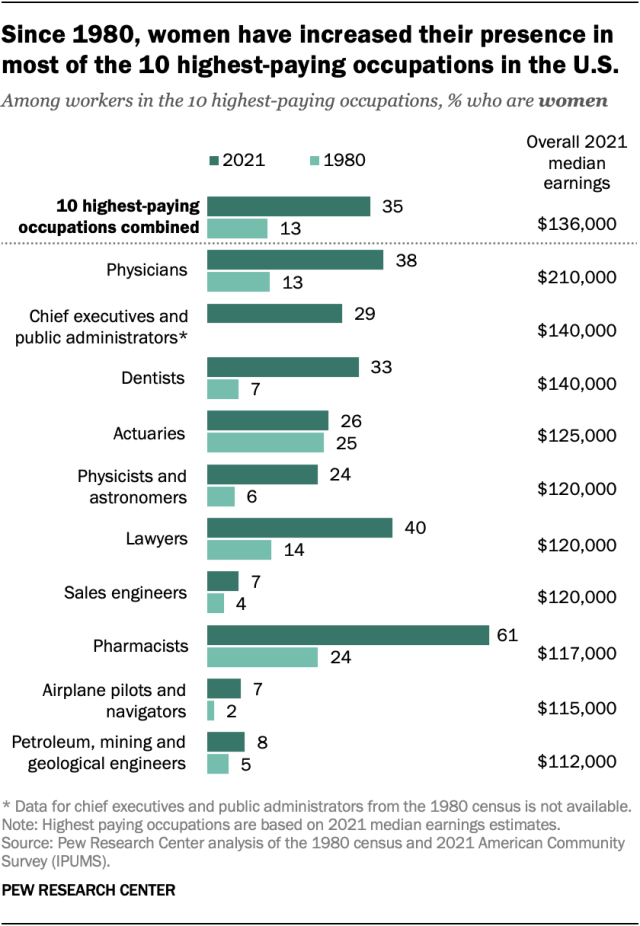
Still, women remain the minority in nine of the 10 highest-paying occupations. The exception is pharmacists, 61% of whom are women. More broadly, the share of women across all 10 of these occupations (35%) remains well below their share of the overall U.S. workforce (47%).
Workers in the 10 highest-paying occupations typically earn more than $100,000 a year, over twice the national average of $41,000.
Where women have made the most – and least – progress
Women’s presence has changed more noticeably in some of these occupations than in others. Since 1980, the share of women dentists has more than quadrupled (from 7% to 33%), while the share of women physicians has roughly tripled (from 13% to 38%). The share of lawyers who are women has risen from 14% to 40%.
The shares of women working in high-paying engineering fields have increased by smaller margins since 1980: Women make up less than 10% of sales engineers and petroleum, mining and geological engineers.
Additionally, only 7% of airplane pilots and navigators are women, against 2% in 1980.
Women have gained ground in completion of advanced degrees
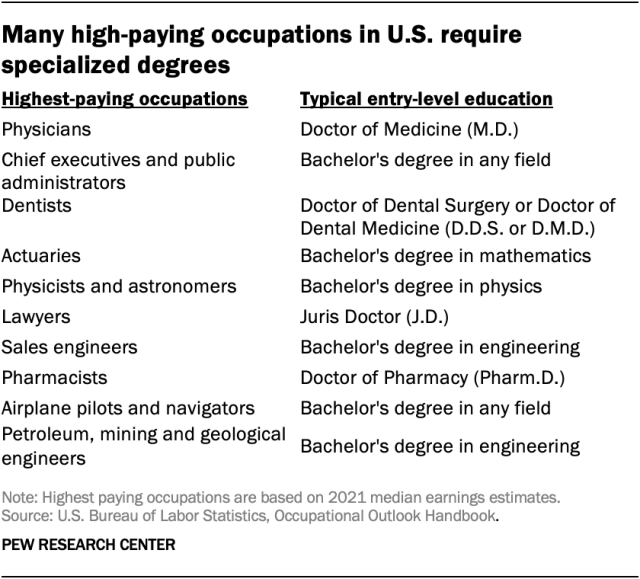
Some of these high-paying occupations – including physicians, lawyers, dentists and pharmacists – require specialized graduate degrees. One way that women have increased their presence in high-paying occupations is by increasingly earning degrees that are required for these jobs.
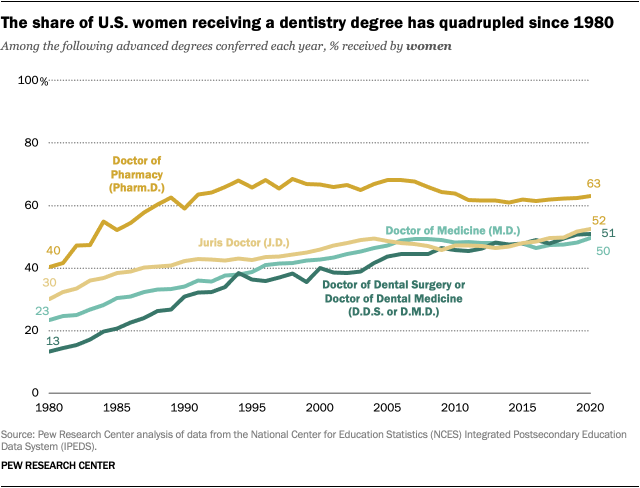
Women now make up about half of those receiving the following advanced degrees:
- Juris Doctor (J.D.): 52% of recipients today are women, versus 30% in 1980
- Doctor of Dental Surgery or Doctor of Dental Medicine (D.D.S. or D.M.D.): 51% of recipients are women, versus 13% in 1980
- Doctor of Medicine (M.D.): 50% of recipients are women, versus 23% in 1980
Women now also earn 63% of Doctor of Pharmacy (Pharm.D.) degrees – similar to their share of workers in the pharmacist occupation (61%). Pharmacists are also the only occupation in the top 10 where women make up the majority. This could be because the field offers flexible work hours, a collaborative environment and family-friendly policies, according to economic research.
However, women remain in the minority among those receiving certain bachelor’s degrees required for some high-paying occupations:
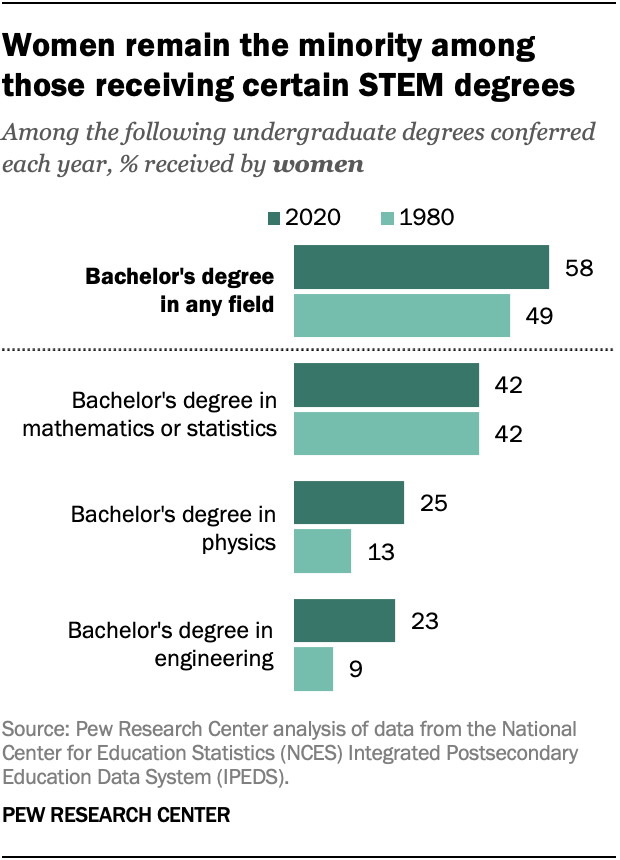
- Mathematics or statistics: 42% of recipients today are women, unchanged from 1980
- Physics: 25% of recipients are women, versus 13% in 1980
- Engineering: 23% of recipients are women, versus 9% in 1980
Outside of undergraduate major selection, there are other reasons women may experience barriers to entering high-paying occupations, even as they achieve parity in many advanced degree programs. Gender differences in household and parenting responsibilities may play a role, as could gender discrimination.

