
Turnout in this year’s primaries for the U.S. House of Representatives surged compared with the last midterms in 2014, particularly among Democrats, according to a Pew Research Center analysis of state election returns.
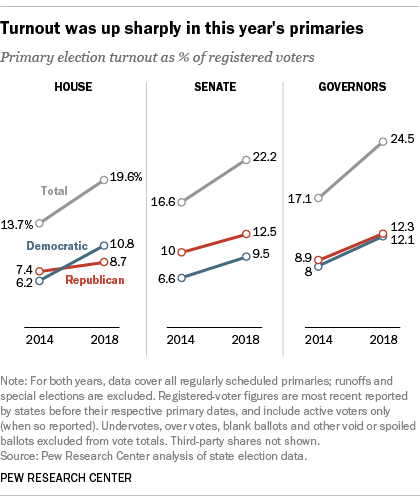
Nearly a fifth (19.6%) of registered voters – about 37 million – cast ballots in House primary elections, according to the analysis of state election results. That may not sound like a lot, but it was a 56% increase over the 23.7 million who voted in 2014’s House primaries; turnout that year was 13.7% of registered voters.
While the battle for control of the House has gotten a lot of public and media attention, turnout rates were also substantially higher in this year’s Senate (22.2%) and gubernatorial (26.5%) primaries than in 2014 (16.6% and 18.6%, respectively), though the increases were relatively similar for both parties.
Voter turnout typically sags across the board in midterm elections relative to presidential years, and primaries nearly always attract fewer voters than general elections. But the elevated primary turnout levels are further evidence that Americans are unusually engaged with this year’s midterms. A recent Pew Research Center survey found that voter enthusiasm is at its highest level for any midterm election in more than two decades.
While turnout rates rose this year in both Democratic and Republican House primaries, the increase was greater on the Democratic side – up 4.6 percentage points, to 10.8% of all registered voters, versus a 1.2-point increase (to 8.7%) on the Republican side. That’s consistent with the Center’s recent survey, which found that while voter enthusiasm is relatively high among voters in both major parties, it’s somewhat higher among voters who favor Democratic over Republican candidates. Two-thirds of Democratic voters (67%) say they are more enthusiastic about voting than in past congressional elections, compared with 59% of Republican voters.
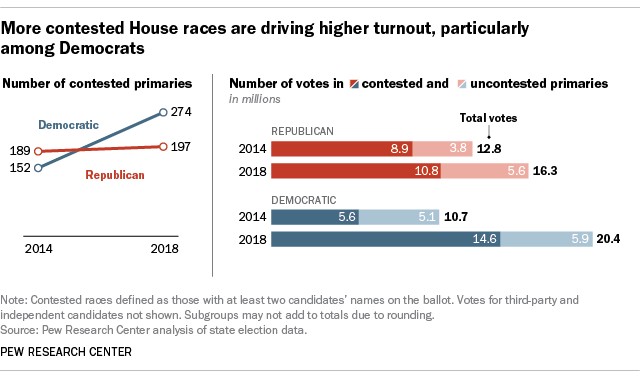
Unlike in 2014, when 2.1 million more votes were cast in Republican than in Democratic House primaries, this year Democratic races drew more votes: 20.4 million versus 16.3 million. That was nearly twice as many votes as the 10.7 million cast in 2014’s Democratic House primaries. One reason: There have been a lot more contested primaries on the Democratic side this year, and contested races tend to attract more voters.
This analysis is based on official vote totals (when available) and voter registration figures from all states except Louisiana, which uses a unique two-stage election system rather than the traditional primary-general structure. Louisiana voters get their first chance to vote for members of Congress in November, while everyone else holds their general election.
We included all valid votes for candidates, including write-in votes when reported, but excluded blank votes and other spoiled or void ballots. Turnout rates were calculated using each state’s most recent reported number of active registered voters prior to the election. And for comparability purposes, we excluded runoffs and special elections from the analysis.
The primaries covered 429 House seats (excluding Louisiana’s six), which means there were potentially 858 contested Republican and Democratic primaries. In many cases, however, there was only one candidate for the nomination (or, sometimes, none at all), so the actual number of primaries with at least two choices on the ballot is a lot smaller.
This year, 471 House primaries (excluding minor parties) were contested by at least two candidates, versus 341 in 2014. Nearly all of that increase has been on the Democratic side, with 122 more contested Democratic House primaries this year (274) than in 2014 (152). By contrast, there have been only eight more contested Republican House primaries so far this year (197) than in 2014 (189).
Nearly 14.6 million people voted in contested Democratic House primaries, more than 2.5 times as many as voted in such races in 2014 (fewer than 5.6 million). Turnout in contested Republican House primaries rose too, but again less so than in the Democratic races: an increase of more than 1.8 million votes between 2014 (8.9 million) and this year (10.8 million).
The rules governing primaries can (and do) vary considerably from state to state, which can make it tricky to compare turnout across time, between states and among different offices.
Several states, such as Virginia, don’t hold primaries in uncontested races; some rely on party conventions to pick nominees, with primary elections as a backstop. In some states, parties limit their primaries to registered members; in other states, especially those that don’t register voters by party, primaries are open to anyone. California and Washington use a “top two” system in which all candidates for a given office run in a single primary; the two gaining the most votes, regardless of party label, advance to the general election in November. This year, Maine used a “ranked choice” system in its primaries, in which voters ranked candidates in order of preference.
More often than you might think, one or the other major party might not even nominate someone for a particular office, depressing turnout while effectively ceding the general election to its main rival – and, in some cases, a clutch of minor parties and write-in candidates. On the other hand, turnout in an uncontested race may be boosted by the presence of a different, contested race on the same ballot. (It’s also important to keep in mind that, based on past experience, partisan disparities in primary turnout don’t necessarily predict individual general-election outcomes.)
Senate, gubernatorial turnout up too
Beyond the closely watched House races, turnout also has been higher in this year’s Senate and gubernatorial primaries. (We analyzed those contests separately, even if they were on the same ballot as the House races, since some people may have voted in one or the other race but not all of them.)
All told, about 29.2 million people voted in 32 states’ regular Senate primaries, or 22.2% of those states’ registered voters. (New York also is electing a senator this year, but there was no primary because both the Democratic incumbent and her Republican challenger were unopposed and nominated by party conventions.) In 2014, 13.8 million people voted in 30 Senate primaries. (Comparisons are difficult because different sets of states voted in 2014 and 2018, a consequence of senators’ staggered terms. In addition, three states in 2014 did not hold Senate primaries, because candidates were either unopposed or chosen by conventions instead.)
Direct comparisons are easier in the 36 states choosing governors this year, because the same states did so four years ago. (Governors serve four-year terms in all states except Vermont and New Hampshire, where they serve for two years.)
Total turnout in those 36 gubernatorial primaries was 36.3 million (24.5% of those states’ registered voters), up from 23.1 million (17.1%) in 2014. There were no gubernatorial primaries in South Carolina four years ago, as both the Republican and Democratic nominations were uncontested, but that wouldn’t come close to explaining the 13 million-plus voting gap. (Only 608,451 South Carolinians voted in this year’s gubernatorial primaries, both of which were contested.) More likely is the fact that a lot more incumbent governors were running for re-election four years ago: There were only seven open races for governor in 2014, compared with 16 this year.
This is an update of a post that originally was published July 27, 2018.
